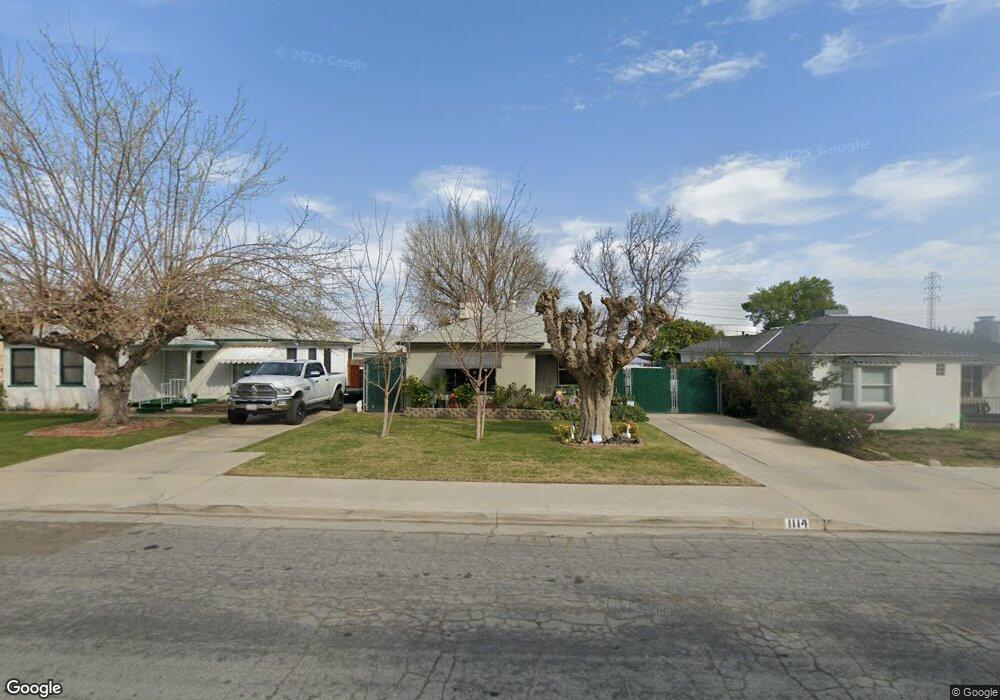
1114 Doyle St Bakersfield, CA 93308
Estimated Value: $229,728 - $250,000
2
Beds
1
Bath
990
Sq Ft
$244/Sq Ft
Est. Value
About This Home
This home is located at 1114 Doyle St, Bakersfield, CA 93308 and is currently estimated at $241,182, approximately $243 per square foot. 1114 Doyle St is a home located in Kern County with nearby schools including Standard Elementary School, Standard Middle School, and North High School.
Ownership History
Date
Name
Owned For
Owner Type
Purchase Details
Closed on
Nov 4, 2025
Sold by
Gillet Jimmie D
Bought by
Gillet Jimmie D and Gillet Judith Diane
Current Estimated Value
Home Financials for this Owner
Home Financials are based on the most recent Mortgage that was taken out on this home.
Original Mortgage
$187,500
Outstanding Balance
$186,973
Interest Rate
6.34%
Mortgage Type
New Conventional
Estimated Equity
$54,209
Purchase Details
Closed on
Sep 29, 2015
Sold by
Ludy Jim E and Ludy Caroline A
Bought by
Gillet Jimmie D
Home Financials for this Owner
Home Financials are based on the most recent Mortgage that was taken out on this home.
Original Mortgage
$104,500
Interest Rate
3.81%
Mortgage Type
New Conventional
Purchase Details
Closed on
May 9, 2011
Sold by
Wells Fargo Bank Na
Bought by
Ludy Jim E and Ludy Caroline A
Purchase Details
Closed on
Jan 5, 2011
Sold by
Ayala Christina Tina
Bought by
Wells Fargo Bank Na
Purchase Details
Closed on
Mar 20, 2006
Sold by
Brown Zeak and Brown Allie L
Bought by
Ayala Christina Tina
Home Financials for this Owner
Home Financials are based on the most recent Mortgage that was taken out on this home.
Original Mortgage
$154,000
Interest Rate
6.2%
Mortgage Type
Stand Alone First
Create a Home Valuation Report for This Property
The Home Valuation Report is an in-depth analysis detailing your home's value as well as a comparison with similar homes in the area
Purchase History
| Date | Buyer | Sale Price | Title Company |
|---|---|---|---|
| Gillet Jimmie D | -- | Ticor Title Company | |
| Gillet Jimmie D | $110,000 | Chicago Title Company | |
| Ludy Jim E | $76,000 | Chicago Title Company | |
| Wells Fargo Bank Na | $44,982 | Accommodation | |
| Ayala Christina Tina | $194,000 | Chicago Title Company |
Source: Public Records
Mortgage History
| Date | Status | Borrower | Loan Amount |
|---|---|---|---|
| Open | Gillet Jimmie D | $187,500 | |
| Previous Owner | Gillet Jimmie D | $104,500 | |
| Previous Owner | Ayala Christina Tina | $154,000 |
Source: Public Records
Tax History
| Year | Tax Paid | Tax Assessment Tax Assessment Total Assessment is a certain percentage of the fair market value that is determined by local assessors to be the total taxable value of land and additions on the property. | Land | Improvement |
|---|---|---|---|---|
| 2025 | $2,447 | $130,211 | $29,591 | $100,620 |
| 2024 | $2,361 | $127,659 | $29,011 | $98,648 |
| 2023 | $2,361 | $125,157 | $28,443 | $96,714 |
| 2022 | $2,277 | $122,704 | $27,886 | $94,818 |
| 2021 | $2,184 | $120,299 | $27,340 | $92,959 |
| 2020 | $2,097 | $119,066 | $27,060 | $92,006 |
| 2019 | $2,069 | $119,066 | $27,060 | $92,006 |
| 2018 | $1,994 | $114,444 | $26,010 | $88,434 |
| 2017 | $1,977 | $112,200 | $25,500 | $86,700 |
| 2016 | $1,823 | $110,000 | $25,000 | $85,000 |
| 2015 | $1,565 | $81,014 | $15,989 | $65,025 |
| 2014 | $1,533 | $79,428 | $15,676 | $63,752 |
Source: Public Records
Map
Nearby Homes
- 1100 Glade St
- 828 Iris St
- 222 Hughes Ave
- 115 Ferguson Ave
- 118 Hughes Ave
- 1800 Carrere St
- 109 Hughes Ave
- 702 Lilac St
- 1601 N Chester Ave
- 111 Justine St
- 112 Woodrow Ave
- 2104 Watson St
- 200 E Warren Ave
- 703 Wisteria St
- 201 E Warren Ave
- 713 Wisteria St
- 114 E Warren Ave
- 400 E Roberts Ln Unit 48
- 400 E Roberts Ln Unit 95
- 400 E Roberts Ln Unit 30
- 1116 Doyle St
- 1110 Doyle St
- 1108 Doyle St
- 1113 Glade St
- 1118 Doyle St Unit B, 403 East Minner
- 1118 Doyle St
- 1115 Glade St
- 1111 Glade St
- 1117 Glade St
- 1109 Glade St
- 1106 Doyle St
- 1119 Glade St
- 1107 Glade St
- 1105 Glade St
- 1102 Doyle St
- 1103 Glade St
- 1110 Glade St
- 1100 Doyle St
- 1112 Glade St
- 1114 Glade St
Your Personal Tour Guide
Ask me questions while you tour the home.