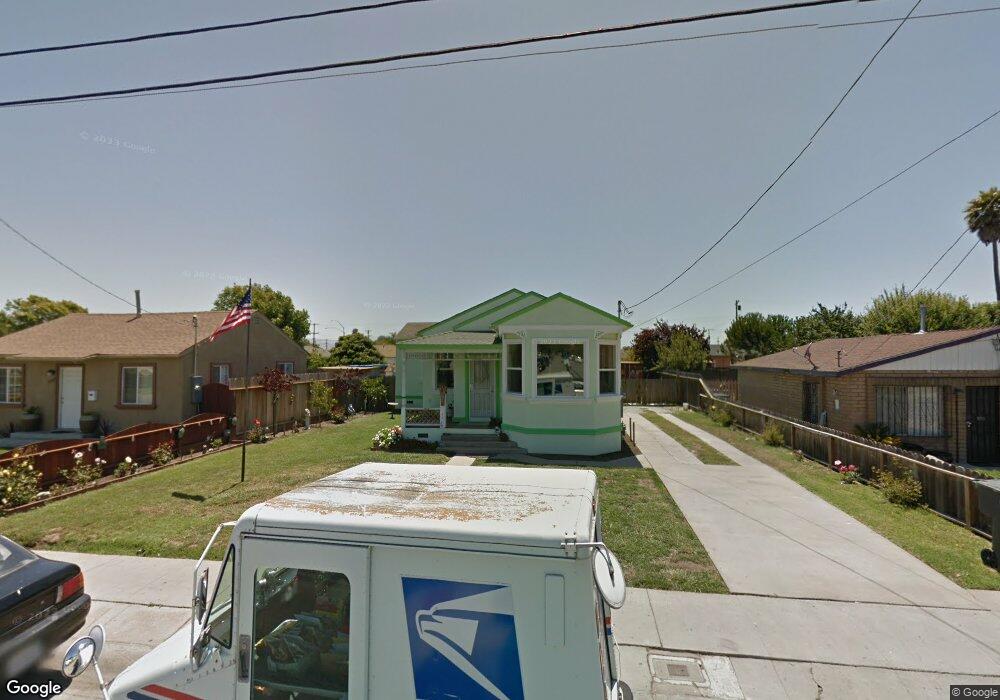
1114 Garner Ave Salinas, CA 93905
East Salinas NeighborhoodEstimated Value: $537,243 - $622,000
3
Beds
1
Bath
1,171
Sq Ft
$500/Sq Ft
Est. Value
About This Home
This home is located at 1114 Garner Ave, Salinas, CA 93905 and is currently estimated at $585,561, approximately $500 per square foot. 1114 Garner Ave is a home located in Monterey County with nearby schools including Dr. Martin Luther King, Jr. Academy, El Sausal Middle School, and Alisal High School.
Ownership History
Date
Name
Owned For
Owner Type
Purchase Details
Closed on
Jul 6, 2011
Sold by
Hanly Bernard E
Bought by
Hanly Bernard E and The Bernard E Hanly 1998 Revocable Trust
Current Estimated Value
Purchase Details
Closed on
Jan 28, 2010
Sold by
Hanly Bernard E and Hanly Benard E
Bought by
Hanly Bernard E
Home Financials for this Owner
Home Financials are based on the most recent Mortgage that was taken out on this home.
Original Mortgage
$85,000
Outstanding Balance
$56,256
Interest Rate
5.03%
Mortgage Type
New Conventional
Estimated Equity
$529,305
Purchase Details
Closed on
Nov 17, 2008
Sold by
Wells Fargo Bank Na
Bought by
Hanly Benard E
Purchase Details
Closed on
Feb 9, 2006
Sold by
Hernandez Martha
Bought by
Barajas Maria
Home Financials for this Owner
Home Financials are based on the most recent Mortgage that was taken out on this home.
Original Mortgage
$336,000
Interest Rate
6.62%
Mortgage Type
New Conventional
Purchase Details
Closed on
Sep 7, 2004
Sold by
Klopfenstein Robert L
Bought by
Klopfenstein Robert L
Create a Home Valuation Report for This Property
The Home Valuation Report is an in-depth analysis detailing your home's value as well as a comparison with similar homes in the area
Home Values in the Area
Average Home Value in this Area
Purchase History
| Date | Buyer | Sale Price | Title Company |
|---|---|---|---|
| Hanly Bernard E | -- | None Available | |
| Hanly Bernard E | -- | Chicago Title Company | |
| Hanly Benard E | $93,500 | First American Title Company | |
| Barajas Maria | $420,000 | Old Republic Title Company | |
| Klopfenstein Robert L | -- | -- |
Source: Public Records
Mortgage History
| Date | Status | Borrower | Loan Amount |
|---|---|---|---|
| Open | Hanly Bernard E | $85,000 | |
| Previous Owner | Barajas Maria | $336,000 |
Source: Public Records
Tax History
| Year | Tax Paid | Tax Assessment Tax Assessment Total Assessment is a certain percentage of the fair market value that is determined by local assessors to be the total taxable value of land and additions on the property. | Land | Improvement |
|---|---|---|---|---|
| 2025 | $1,620 | $120,386 | $64,379 | $56,007 |
| 2024 | $1,620 | $118,026 | $63,117 | $54,909 |
| 2023 | $1,591 | $115,713 | $61,880 | $53,833 |
| 2022 | $1,433 | $113,445 | $60,667 | $52,778 |
| 2021 | $1,433 | $111,222 | $59,478 | $51,744 |
| 2020 | $1,417 | $110,083 | $58,869 | $51,214 |
| 2019 | $1,459 | $107,925 | $57,715 | $50,210 |
| 2018 | $1,375 | $105,810 | $56,584 | $49,226 |
| 2017 | $1,426 | $103,736 | $55,475 | $48,261 |
| 2016 | $1,354 | $101,703 | $54,388 | $47,315 |
| 2015 | $1,342 | $100,177 | $53,572 | $46,605 |
| 2014 | $1,295 | $98,216 | $52,523 | $45,693 |
Source: Public Records
Map
Nearby Homes
- 933 Acosta Plaza Unit 35
- 1046 C St
- 948 Rider Ave
- 11 E Laurel Dr
- 11 Hill Cir
- 755 Pino Way
- 609 Saint George Dr
- 11 Fresa Place
- 544 Saint George Dr
- 230 Paloma Ave
- 320 N Sanborn Rd
- 724 Circle Dr
- 1094 Twin Creeks Dr
- 1049 Twin Creeks Dr
- 129 N Filice St
- 1215 Campania Way
- 1544 Saguaro Dr Unit 4
- 18 Hancock Cir
- 78 Ragsdale Ct
- 11 Saguaro Cir
- 1052 Garner Ave
- 1118 Garner Ave
- 1048 Garner Ave
- 1055 Alma Ave
- 1104 Garner Ave
- 1051 Alma Ave
- 1044 Garner Ave
- 501 Green St
- 1109 Alma Ave
- 1045 Alma Ave
- 1042 Garner Ave
- 1113 Alma Ave
- 1106 Garner Ave
- 1041 Alma Ave
- 1119 Garner Ave
- 1045 Garner Ave
- 1115 Alma Ave
- 1112 Garner Ave
- 1041 Garner Ave
- 0 Encinal Unit ML81054775
Your Personal Tour Guide
Ask me questions while you tour the home.