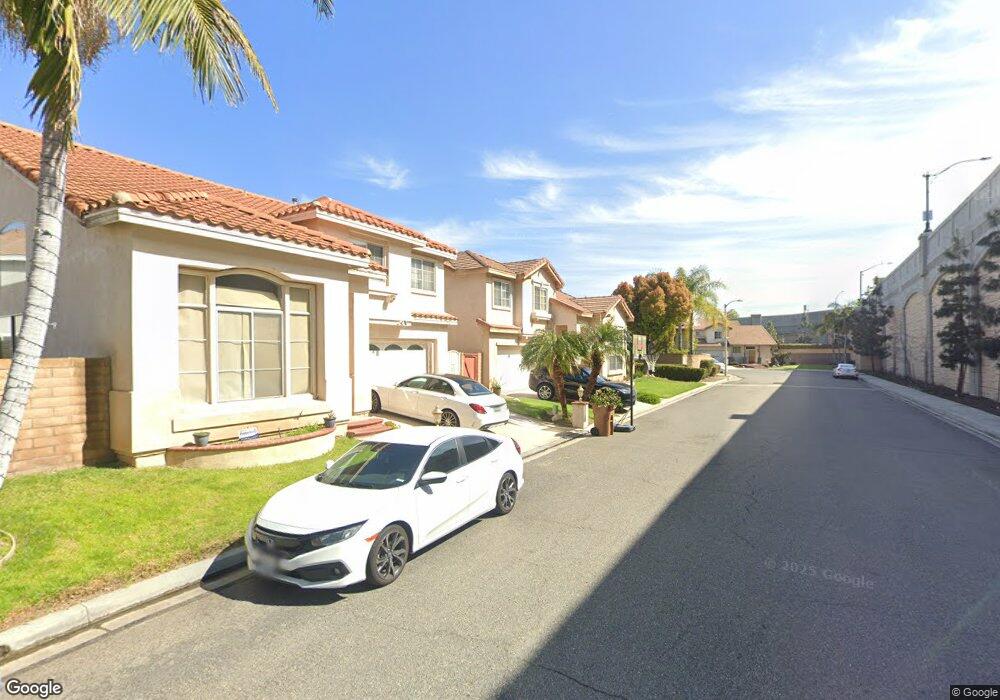
1114 Montego Way Placentia, CA 92870
Estimated Value: $998,000 - $1,110,270
4
Beds
3
Baths
1,894
Sq Ft
$558/Sq Ft
Est. Value
About This Home
This home is located at 1114 Montego Way, Placentia, CA 92870 and is currently estimated at $1,057,568, approximately $558 per square foot. 1114 Montego Way is a home located in Orange County with nearby schools including John O. Tynes Elementary School, Kraemer Middle School, and Valencia High School.
Ownership History
Date
Name
Owned For
Owner Type
Purchase Details
Closed on
Mar 1, 2024
Sold by
Fought Cathleene
Bought by
Fought Cathleene
Current Estimated Value
Home Financials for this Owner
Home Financials are based on the most recent Mortgage that was taken out on this home.
Original Mortgage
$642,000
Outstanding Balance
$631,322
Interest Rate
6.63%
Mortgage Type
New Conventional
Estimated Equity
$426,246
Purchase Details
Closed on
Mar 21, 2016
Sold by
Fought Thomas
Bought by
Fought Cathleene
Purchase Details
Closed on
Mar 9, 1995
Sold by
Haseko Townhomes Inc
Bought by
Fought Thomas Ronald and Fought Cathleene Marie
Home Financials for this Owner
Home Financials are based on the most recent Mortgage that was taken out on this home.
Original Mortgage
$190,800
Interest Rate
8.86%
Create a Home Valuation Report for This Property
The Home Valuation Report is an in-depth analysis detailing your home's value as well as a comparison with similar homes in the area
Home Values in the Area
Average Home Value in this Area
Purchase History
| Date | Buyer | Sale Price | Title Company |
|---|---|---|---|
| Fought Cathleene | -- | Wfg Lender Services | |
| Fought Cathleene | -- | Wfg Lender Services | |
| Fought Cathleene | -- | None Available | |
| Fought Thomas Ronald | $212,000 | First American Title Ins |
Source: Public Records
Mortgage History
| Date | Status | Borrower | Loan Amount |
|---|---|---|---|
| Open | Fought Cathleene | $642,000 | |
| Closed | Fought Cathleene | $642,000 | |
| Previous Owner | Fought Thomas Ronald | $190,800 |
Source: Public Records
Tax History
| Year | Tax Paid | Tax Assessment Tax Assessment Total Assessment is a certain percentage of the fair market value that is determined by local assessors to be the total taxable value of land and additions on the property. | Land | Improvement |
|---|---|---|---|---|
| 2025 | $4,689 | $356,085 | $60,662 | $295,423 |
| 2024 | $4,689 | $349,103 | $59,472 | $289,631 |
| 2023 | $4,579 | $342,258 | $58,306 | $283,952 |
| 2022 | $4,492 | $335,548 | $57,163 | $278,385 |
| 2021 | $4,370 | $328,969 | $56,042 | $272,927 |
| 2020 | $4,381 | $325,596 | $55,467 | $270,129 |
| 2019 | $4,207 | $319,212 | $54,379 | $264,833 |
| 2018 | $4,152 | $312,953 | $53,312 | $259,641 |
| 2017 | $4,082 | $306,817 | $52,267 | $254,550 |
| 2016 | $4,004 | $300,801 | $51,242 | $249,559 |
| 2015 | $3,952 | $296,283 | $50,472 | $245,811 |
| 2014 | $3,847 | $290,480 | $49,484 | $240,996 |
Source: Public Records
Map
Nearby Homes
- 1030 Davis Way
- 988 Spyglass Place
- 1748 N Oxford St
- 731 Langer Dr
- 549 Fordham Dr
- 605 Patten Ave
- 603 Patten Ave
- 585 Patten Ave
- 548 Vanderbilt Dr
- 554 Vanderbilt Dr
- 635 Patten Ave
- 3151 E Radcliffe Ave
- 114 Byrnes Ln Unit 9
- 212 S Kraemer Blvd Unit 2208
- 937 Finnell Way
- 1460 Holcomb Place Unit 23
- 1126 Naples Ave
- 1000 Henrietta Cir
- 205 Oahu Way
- 1280 Dominica Cir
- 1106 Montego Way
- 1130 Mira Lago Ln
- 1136 Mira Lago Ln
- 1126 Mira Lago Ln
- 144 Majorca Place
- 138 Majorca Place
- 150 Majorca Place
- 1118 Mira Lago Ln
- 126 Majorca Place
- 1131 Mira Lago Ln
- 1131 Mira Lago Ln E
- 1137 Mira Lago Ln
- 1125 Mira Lago Ln
- 120 Majorca Place
- 1143 Mira Lago Ln
- 1119 Mira Lago Ln
- 145 Majorca Place
- 145 Majorca Place S
- 139 Majorca Place
- 1113 Mira Lago Ln
Your Personal Tour Guide
Ask me questions while you tour the home.