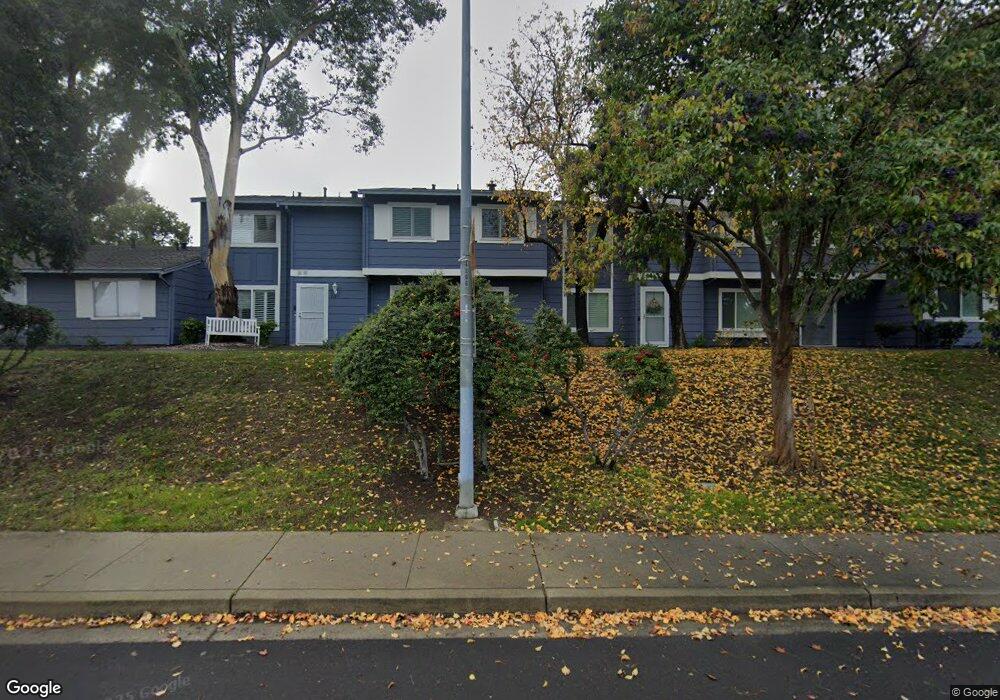
1114 Spring Valley Common Livermore, CA 94551
Springtown NeighborhoodEstimated Value: $465,802 - $627,000
2
Beds
1
Bath
850
Sq Ft
$653/Sq Ft
Est. Value
About This Home
This home is located at 1114 Spring Valley Common, Livermore, CA 94551 and is currently estimated at $555,451, approximately $653 per square foot. 1114 Spring Valley Common is a home located in Alameda County with nearby schools including Junction Avenue K-8 School, Livermore High School, and St Michael's School.
Ownership History
Date
Name
Owned For
Owner Type
Purchase Details
Closed on
Sep 2, 2009
Sold by
Hsbc Bank Usa National Association
Bought by
Gazda Gilbert R
Current Estimated Value
Home Financials for this Owner
Home Financials are based on the most recent Mortgage that was taken out on this home.
Original Mortgage
$162,011
Outstanding Balance
$106,277
Interest Rate
5.25%
Mortgage Type
FHA
Estimated Equity
$449,174
Purchase Details
Closed on
May 1, 2009
Sold by
Cutting Kendra
Bought by
Us Bank National Association and Wfmbs 2006 Ar10
Purchase Details
Closed on
Jan 9, 2006
Sold by
Cutting Marcy
Bought by
Cutting Kendra
Purchase Details
Closed on
Oct 20, 2004
Sold by
Verzi Steven
Bought by
Cutting Kendra and Cutting Marcy
Home Financials for this Owner
Home Financials are based on the most recent Mortgage that was taken out on this home.
Original Mortgage
$264,000
Interest Rate
5.82%
Mortgage Type
Stand Alone First
Purchase Details
Closed on
Jun 15, 2004
Sold by
Verzi Scott and Elizabeth Ann Ryder Revocable
Bought by
Verzi Steven
Purchase Details
Closed on
Dec 20, 2002
Sold by
Ryder Elizabeth A
Bought by
Ryder Elizabeth Ann and Elizabeth Ann Ryder Revocable
Home Financials for this Owner
Home Financials are based on the most recent Mortgage that was taken out on this home.
Original Mortgage
$187,500
Interest Rate
5.88%
Purchase Details
Closed on
Oct 31, 2002
Sold by
Cantrell Casey L and Cantrell Bethany D
Bought by
Ryder Elizabeth A
Home Financials for this Owner
Home Financials are based on the most recent Mortgage that was taken out on this home.
Original Mortgage
$187,500
Interest Rate
5.88%
Purchase Details
Closed on
Jan 13, 2000
Sold by
Malpeli Fortunata L and Malpeli Ernestina M
Bought by
Cantrell Casey L and Cantrell Bethany D
Home Financials for this Owner
Home Financials are based on the most recent Mortgage that was taken out on this home.
Original Mortgage
$160,680
Interest Rate
8.25%
Purchase Details
Closed on
Oct 5, 1995
Sold by
Malpeli Fortunata
Bought by
Malpeli Fortunata Louise and Shay Ernestina M
Purchase Details
Closed on
Jun 6, 1994
Sold by
Gilmore Ozell
Bought by
Malpeli Fortunata
Create a Home Valuation Report for This Property
The Home Valuation Report is an in-depth analysis detailing your home's value as well as a comparison with similar homes in the area
Home Values in the Area
Average Home Value in this Area
Purchase History
| Date | Buyer | Sale Price | Title Company |
|---|---|---|---|
| Gazda Gilbert R | $165,000 | Orange Coast Title Lender Se | |
| Hsbc Bank Usa National Association | -- | Orange Coast Title Lender Se | |
| Us Bank National Association | $187,000 | Accommodation | |
| Cutting Kendra | -- | Old Republic Title Company | |
| Cutting Kendra | $330,000 | Ticor Title Company | |
| Verzi Steven | -- | -- | |
| Ryder Elizabeth Ann | -- | -- | |
| Ryder Elizabeth A | $252,000 | -- | |
| Cantrell Casey L | $161,000 | Financial Title Company | |
| Malpeli Fortunata Louise | -- | -- | |
| Malpeli Fortunata | $125,000 | North American Title Co Inc |
Source: Public Records
Mortgage History
| Date | Status | Borrower | Loan Amount |
|---|---|---|---|
| Open | Gazda Gilbert R | $162,011 | |
| Previous Owner | Cutting Kendra | $264,000 | |
| Previous Owner | Ryder Elizabeth A | $187,500 | |
| Previous Owner | Cantrell Casey L | $160,680 |
Source: Public Records
Tax History
| Year | Tax Paid | Tax Assessment Tax Assessment Total Assessment is a certain percentage of the fair market value that is determined by local assessors to be the total taxable value of land and additions on the property. | Land | Improvement |
|---|---|---|---|---|
| 2025 | $3,361 | $212,970 | $63,891 | $149,079 |
| 2024 | $3,361 | $208,795 | $62,638 | $146,157 |
| 2023 | $3,298 | $204,701 | $61,410 | $143,291 |
| 2022 | $3,238 | $200,688 | $60,206 | $140,482 |
| 2021 | $3,163 | $196,755 | $59,026 | $137,729 |
| 2020 | $3,040 | $194,738 | $58,421 | $136,317 |
| 2019 | $3,020 | $190,921 | $57,276 | $133,645 |
| 2018 | $2,946 | $187,178 | $56,153 | $131,025 |
| 2017 | $2,864 | $183,508 | $55,052 | $128,456 |
| 2016 | $2,668 | $179,911 | $53,973 | $125,938 |
| 2015 | $2,534 | $177,211 | $53,163 | $124,048 |
| 2014 | $2,501 | $173,741 | $52,122 | $121,619 |
Source: Public Records
Map
Nearby Homes
- 1031 Spring Valley Common
- 1128 Larkspur Dr
- 1264 Tulip Way
- 884 Sungold Cir Unit 123
- 1905 Monterey Dr
- 5251 Peony Dr
- 4363 Golf Dr
- 5365 Windflower Dr
- 4723 Marengo Common
- 4707 Marengo Common
- 4711 Marengo Common
- 1817 Bluebell Dr
- 5473 Rainflower Dr
- 4715 Marengo Common
- 5457 Treeflower Dr
- 4128 Camrose Ave
- 5741 Rainflower Dr
- 883 Barney Com
- 3873 Inverness Common
- 3473 Edinburgh Dr
- 1122 Spring Valley Common
- 1126 Spring Valley Common
- 1092 Spring Valley Common
- 1138 Spring Valley Common
- 1088 Spring Valley Common
- 1140 Spring Valley Common
- 1076 Spring Valley Common
- 1144 Spring Valley Common
- 1070 Spring Valley Common
- 1062 Spring Valley Common
- 1115 Spring Valley Common
- 1111 Spring Valley Common
- 1129 Spring Valley Common
- 1107 Spring Valley Common
- 1133 Spring Valley Common
- 1103 Spring Valley Common
- 1152 Spring Valley Common
- 1152 Spring Valley Common
- 1075 Spring Valley Common
- 1166 Spring Valley Common
Your Personal Tour Guide
Ask me questions while you tour the home.