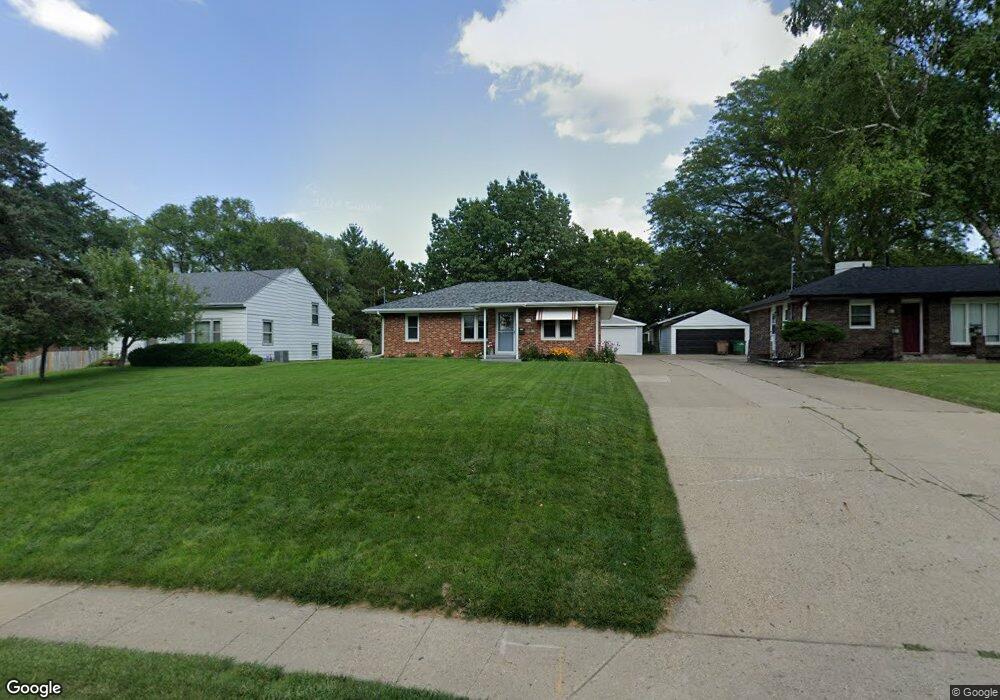
1115 8th St West Des Moines, IA 50265
Estimated Value: $234,000 - $248,000
3
Beds
1
Bath
1,031
Sq Ft
$233/Sq Ft
Est. Value
About This Home
This home is located at 1115 8th St, West Des Moines, IA 50265 and is currently estimated at $240,084, approximately $232 per square foot. 1115 8th St is a home located in Polk County with nearby schools including Hillside Elementary School, Stilwell Junior High School, and Valley Southwoods Freshman High School.
Create a Home Valuation Report for This Property
The Home Valuation Report is an in-depth analysis detailing your home's value as well as a comparison with similar homes in the area
Home Values in the Area
Average Home Value in this Area
Tax History Compared to Growth
Tax History
| Year | Tax Paid | Tax Assessment Tax Assessment Total Assessment is a certain percentage of the fair market value that is determined by local assessors to be the total taxable value of land and additions on the property. | Land | Improvement |
|---|---|---|---|---|
| 2025 | $2,864 | $218,500 | $64,200 | $154,300 |
| 2024 | $2,864 | $199,800 | $57,800 | $142,000 |
| 2023 | $2,992 | $199,800 | $57,800 | $142,000 |
| 2022 | $2,954 | $167,200 | $50,100 | $117,100 |
| 2021 | $2,804 | $167,200 | $50,100 | $117,100 |
| 2020 | $2,756 | $151,700 | $45,400 | $106,300 |
| 2019 | $2,582 | $151,700 | $45,400 | $106,300 |
| 2018 | $2,582 | $137,800 | $40,400 | $97,400 |
| 2017 | $2,456 | $137,800 | $40,400 | $97,400 |
| 2016 | $2,398 | $128,000 | $37,100 | $90,900 |
| 2015 | $2,398 | $128,000 | $37,100 | $90,900 |
| 2014 | $1,202 | $126,200 | $35,900 | $90,300 |
Source: Public Records
Map
Nearby Homes
- 720 Valhigh Rd
- 829 7th St
- 2335 SE 5th St
- 6513 Center St
- 686 63rd St
- 924 13th St
- 6420 Center St
- 701 10th St
- 720 63rd St
- 6330 Center St
- 704 12th St
- 800 13th St
- 208 Prospect Ave
- 6750 School St Unit 206
- 6750 School St Unit 205
- 608 5th St Unit 2
- 616 4th St
- 1426 S Auburn Place
- 529 6th St Unit 2
- 525 6th St Unit 2