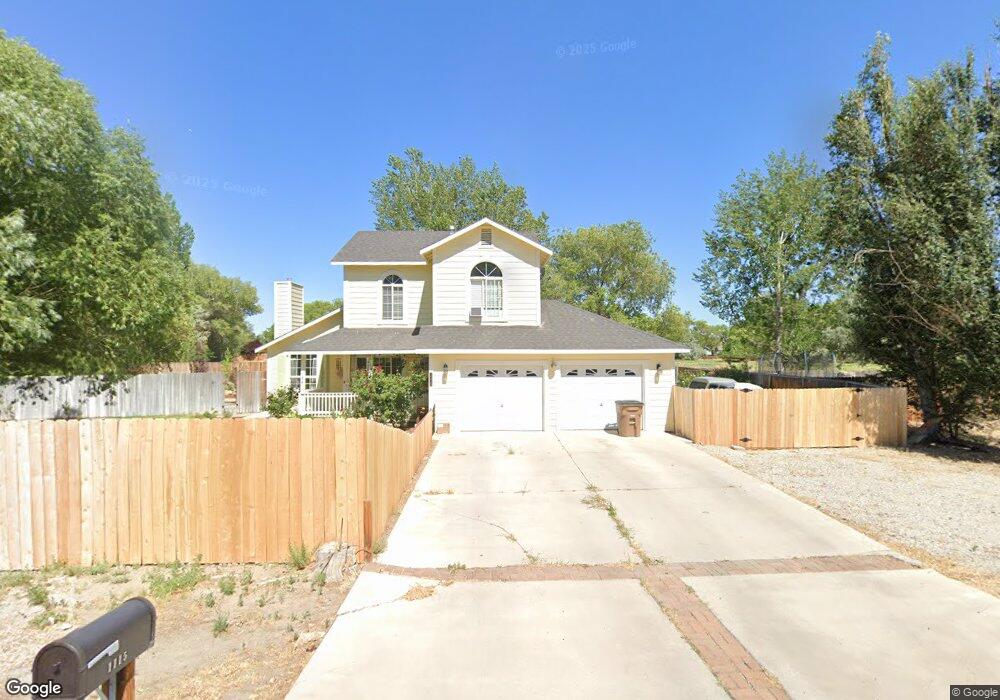
1115 Bon Accord Ln Unit 1 Fallon, NV 89406
Estimated Value: $385,000 - $424,322
3
Beds
3
Baths
1,626
Sq Ft
$251/Sq Ft
Est. Value
About This Home
This home is located at 1115 Bon Accord Ln Unit 1, Fallon, NV 89406 and is currently estimated at $408,581, approximately $251 per square foot. 1115 Bon Accord Ln Unit 1 is a home located in Churchill County with nearby schools including Lahontan Elementary School, E.C. Best Elementary School, and Numa Elementary School.
Ownership History
Date
Name
Owned For
Owner Type
Purchase Details
Closed on
Sep 5, 2023
Sold by
Giraud Michael A and Giraud Allen M
Bought by
Harrison Carol
Current Estimated Value
Purchase Details
Closed on
Dec 9, 2022
Sold by
Giraud Sandra L
Bought by
Giraud Michael A
Home Financials for this Owner
Home Financials are based on the most recent Mortgage that was taken out on this home.
Original Mortgage
$324,300
Interest Rate
7.08%
Mortgage Type
New Conventional
Purchase Details
Closed on
Dec 7, 2022
Sold by
Alves Isidro G and Alves Heather M
Bought by
Giraud Michael A and Giraud Allen M
Home Financials for this Owner
Home Financials are based on the most recent Mortgage that was taken out on this home.
Original Mortgage
$324,300
Interest Rate
7.08%
Mortgage Type
New Conventional
Create a Home Valuation Report for This Property
The Home Valuation Report is an in-depth analysis detailing your home's value as well as a comparison with similar homes in the area
Home Values in the Area
Average Home Value in this Area
Purchase History
| Date | Buyer | Sale Price | Title Company |
|---|---|---|---|
| Harrison Carol | $395,000 | Western Nevada Title Agency | |
| Giraud Michael A | -- | Western Nevada Title Agency | |
| Giraud Michael A | $345,000 | Western Nevada Title Agency |
Source: Public Records
Mortgage History
| Date | Status | Borrower | Loan Amount |
|---|---|---|---|
| Previous Owner | Giraud Michael A | $324,300 | |
| Previous Owner | Giraud Michael A | $324,300 |
Source: Public Records
Tax History Compared to Growth
Tax History
| Year | Tax Paid | Tax Assessment Tax Assessment Total Assessment is a certain percentage of the fair market value that is determined by local assessors to be the total taxable value of land and additions on the property. | Land | Improvement |
|---|---|---|---|---|
| 2025 | $1,838 | $91,438 | $23,170 | $68,268 |
| 2024 | $1,838 | $86,724 | $21,420 | $65,304 |
| 2023 | $1,838 | $80,639 | $21,420 | $59,219 |
| 2022 | $1,620 | $67,706 | $16,300 | $51,406 |
| 2021 | $1,569 | $66,289 | $16,300 | $49,989 |
| 2020 | $1,518 | $67,329 | $16,300 | $51,029 |
| 2019 | $1,466 | $66,041 | $16,300 | $49,741 |
| 2018 | $1,421 | $57,987 | $9,625 | $48,362 |
| 2017 | $1,694 | $58,075 | $9,625 | $48,450 |
| 2016 | $1,660 | $54,674 | $9,625 | $45,049 |
| 2015 | $1,304 | $47,682 | $9,625 | $38,057 |
| 2014 | $1,268 | $42,393 | $9,625 | $32,768 |
Source: Public Records
Map
Nearby Homes
- 2998 Alcorn Rd
- 3116 Dallas Dr
- 3180 Dallas Dr
- 3275 Alcorn Rd
- 3300 Alcorn Rd
- 3350 Della Cir
- 125 Deer Creek Cir
- APN 007-091-73 Casey Rd
- APN 007-091-70 Casey Rd
- APN 007-091-75 Casey Rd
- APN 007-091-74 Casey Rd
- APN 007-091-72 Casey Rd
- APN 007-091-71 Casey Rd
- 2525 Verona Dr
- 1359 Onda Verde Dr
- 2830 Country Club Dr
- 1044 Allen Rd
- 9.3 Acres off of Highland Dr
- 3375 Duane Dr
- 1951 Albert St
- 1115 Bon Accord Ln
- 1133 Bon Accord Ln
- 1128 Bon Accord Ln
- 1140 Bon Accord Ln
- 1146 Bon Accord Ln
- 2998 Bottom Rd
- 1162 Bon Accord Ln
- 1165 Bon Accord Ln
- 1066 Sarah Belle Ln
- 1034 Sarah Belle Ln
- 3006 Bottom Rd
- 3025 Casey Rd
- 1102 Sarah Belle Ln
- 1170 Bon Accord Ln
- 1175 Bon Accord Ln
- 1124 Sarah Belle Ln
- 1174 Bon Accord Ln
- 2995 Alcorn Rd
- 3022 Bottom Rd
- 2977 Alcorn Rd