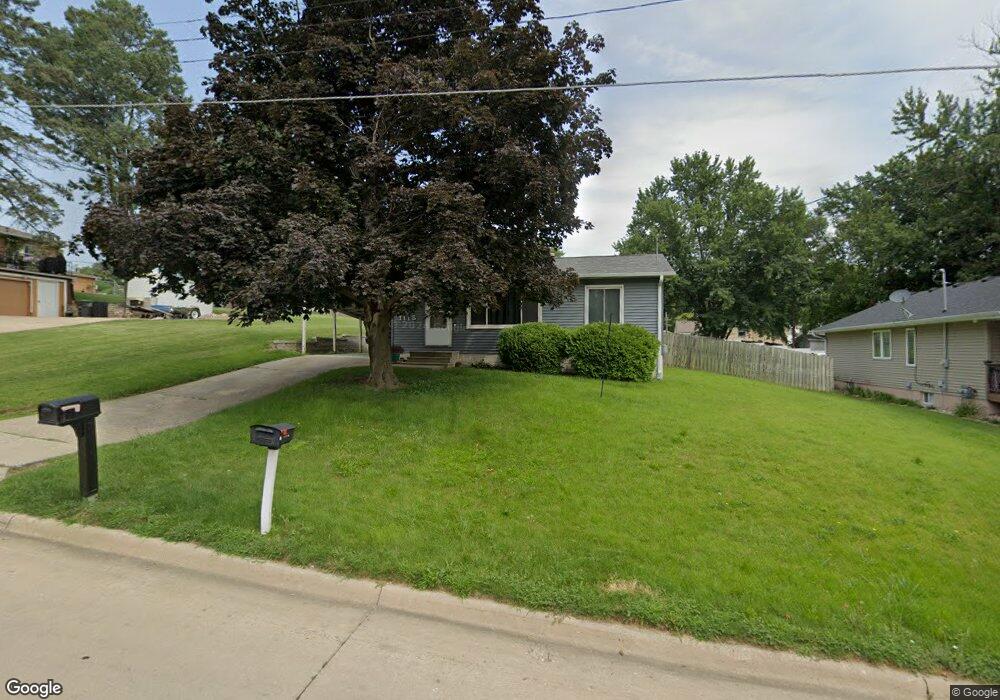
1115 Burnham Ave Des Moines, IA 50315
Watrous South NeighborhoodEstimated Value: $155,000 - $197,000
2
Beds
1
Bath
778
Sq Ft
$228/Sq Ft
Est. Value
About This Home
This home is located at 1115 Burnham Ave, Des Moines, IA 50315 and is currently estimated at $177,291, approximately $227 per square foot. 1115 Burnham Ave is a home located in Polk County with nearby schools including Morris Elementary School, Mccombs Middle School, and Lincoln High School.
Ownership History
Date
Name
Owned For
Owner Type
Purchase Details
Closed on
Jun 27, 2006
Sold by
Black Roberta L
Bought by
Cherry Brian John and Cherry Amanda
Current Estimated Value
Home Financials for this Owner
Home Financials are based on the most recent Mortgage that was taken out on this home.
Original Mortgage
$97,000
Outstanding Balance
$69,467
Interest Rate
10.9%
Mortgage Type
Purchase Money Mortgage
Estimated Equity
$107,824
Purchase Details
Closed on
Jun 13, 2005
Sold by
Patton John C and Patton Denise
Bought by
Black Roberta L
Home Financials for this Owner
Home Financials are based on the most recent Mortgage that was taken out on this home.
Original Mortgage
$90,578
Interest Rate
5.82%
Mortgage Type
FHA
Purchase Details
Closed on
Feb 22, 2002
Sold by
Agans Mary Lee
Bought by
Patton John C
Home Financials for this Owner
Home Financials are based on the most recent Mortgage that was taken out on this home.
Original Mortgage
$80,750
Interest Rate
7.14%
Create a Home Valuation Report for This Property
The Home Valuation Report is an in-depth analysis detailing your home's value as well as a comparison with similar homes in the area
Home Values in the Area
Average Home Value in this Area
Purchase History
| Date | Buyer | Sale Price | Title Company |
|---|---|---|---|
| Cherry Brian John | $96,500 | None Available | |
| Black Roberta L | $91,500 | -- | |
| Patton John C | $84,500 | -- |
Source: Public Records
Mortgage History
| Date | Status | Borrower | Loan Amount |
|---|---|---|---|
| Open | Cherry Brian John | $97,000 | |
| Previous Owner | Black Roberta L | $90,578 | |
| Previous Owner | Patton John C | $80,750 |
Source: Public Records
Tax History Compared to Growth
Tax History
| Year | Tax Paid | Tax Assessment Tax Assessment Total Assessment is a certain percentage of the fair market value that is determined by local assessors to be the total taxable value of land and additions on the property. | Land | Improvement |
|---|---|---|---|---|
| 2025 | $2,994 | $172,000 | $31,100 | $140,900 |
| 2024 | $2,994 | $152,200 | $27,200 | $125,000 |
| 2023 | $2,868 | $152,200 | $27,200 | $125,000 |
| 2022 | $2,846 | $121,700 | $22,300 | $99,400 |
| 2021 | $2,622 | $121,700 | $22,300 | $99,400 |
| 2020 | $2,724 | $105,100 | $19,200 | $85,900 |
| 2019 | $2,562 | $105,100 | $19,200 | $85,900 |
| 2018 | $2,536 | $95,300 | $17,100 | $78,200 |
| 2017 | $2,480 | $95,300 | $17,100 | $78,200 |
| 2016 | $2,416 | $91,700 | $16,200 | $75,500 |
| 2015 | $2,416 | $91,700 | $16,200 | $75,500 |
| 2014 | $2,382 | $93,000 | $16,100 | $76,900 |
Source: Public Records
Map
Nearby Homes
- 1161 Bundy St
- 1115 Rittenhouse St
- 1029 Bundy St
- 1313 Burnham Ave
- 1115 Wade St
- 1225 West St
- 1334 Wade St
- 1010 Amos Ave
- 6205 SW 12th St
- 7205 SW 13th St
- 1214 Leland Ave
- 1306 Amos Ave
- 1310 Leland Ave
- 6107 SW 14th St
- 7460 Southview Dr
- 7500 SW 12th St
- 1500 Leland Ave
- 6001 SW 13th Place
- 1210 Highview Dr
- 1010 Frederick Ave
- 1111 Burnham Ave
- 1123 Burnham Ave
- 1118 Bundy St
- 1107 Burnham Ave
- 1114 Bundy St
- 1120 Bundy St
- 1112 Bundy St
- 1118 Burnham Ave
- 1122 Bundy St
- 1116 Burnham Ave
- 1120 Burnham Ave
- 1122 Burnham Ave
- 1125 Burnham Ave
- 1110 Bundy St
- 1124 Bundy St
- 1114 Burnham Ave
- 1124 Burnham Ave
- 1105 Burnham Ave
- 1200 Bundy St
- 1108 Bundy St