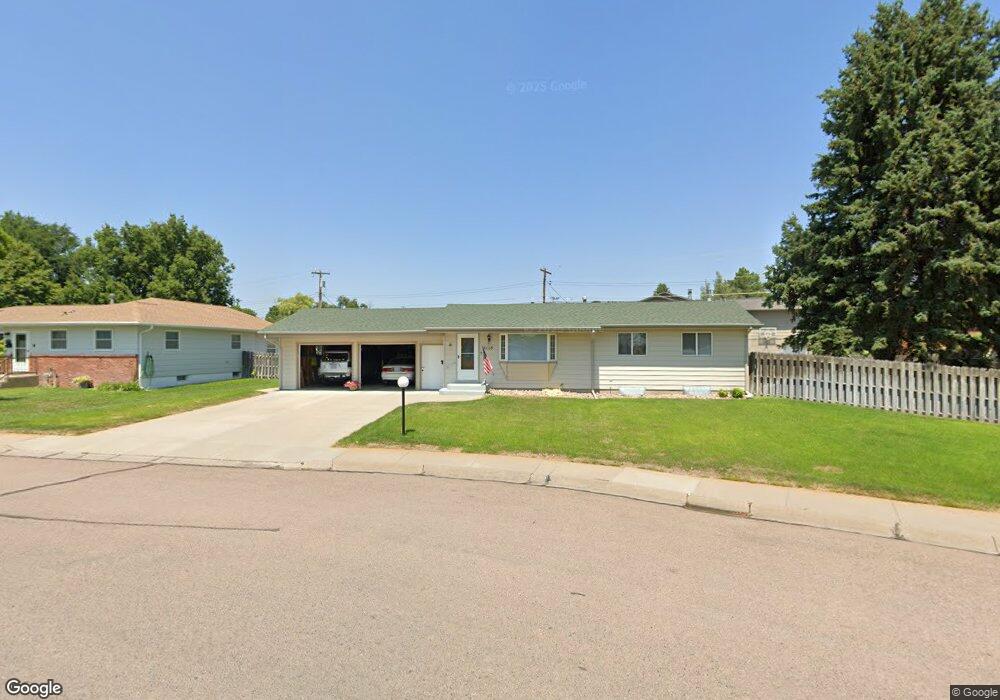
1115 Highland Dr Ogallala, NE 69153
Estimated Value: $232,000 - $263,000
--
Bed
--
Bath
1,092
Sq Ft
$225/Sq Ft
Est. Value
About This Home
This home is located at 1115 Highland Dr, Ogallala, NE 69153 and is currently estimated at $246,126, approximately $225 per square foot. 1115 Highland Dr is a home with nearby schools including Ogallala High School, St. Luke's Elementary School, and St. Paul's Lutheran School.
Ownership History
Date
Name
Owned For
Owner Type
Purchase Details
Closed on
Jan 2, 2025
Sold by
Mccormick Kathleen M
Bought by
Kathleen M Mccormick Revocable Living Trust and Mccormick
Current Estimated Value
Purchase Details
Closed on
Jul 21, 2010
Sold by
Mccroden Eleanor E
Bought by
Mccormick Dennis D and Mccormick Kathleen M
Create a Home Valuation Report for This Property
The Home Valuation Report is an in-depth analysis detailing your home's value as well as a comparison with similar homes in the area
Home Values in the Area
Average Home Value in this Area
Purchase History
| Date | Buyer | Sale Price | Title Company |
|---|---|---|---|
| Kathleen M Mccormick Revocable Living Trust | -- | None Listed On Document | |
| Kathleen M Mccormick Revocable Living Trust | -- | None Listed On Document | |
| Mccormick Dennis D | $92,000 | None Available | |
| Mccroder Eleanor E | -- | None Available |
Source: Public Records
Mortgage History
| Date | Status | Borrower | Loan Amount |
|---|---|---|---|
| Closed | Mccormick Dennis D | $0 |
Source: Public Records
Tax History Compared to Growth
Tax History
| Year | Tax Paid | Tax Assessment Tax Assessment Total Assessment is a certain percentage of the fair market value that is determined by local assessors to be the total taxable value of land and additions on the property. | Land | Improvement |
|---|---|---|---|---|
| 2024 | $216 | $204,370 | $18,660 | $185,710 |
| 2023 | $96 | $180,695 | $15,550 | $165,145 |
| 2022 | $575 | $143,515 | $12,670 | $130,845 |
| 2021 | $1,441 | $132,680 | $12,670 | $120,010 |
| 2020 | $1,441 | $120,490 | $12,670 | $107,820 |
| 2019 | $1,441 | $109,355 | $11,520 | $97,835 |
| 2018 | $1,441 | $103,580 | $11,520 | $92,060 |
| 2017 | $0 | $100,735 | $11,520 | $89,215 |
| 2016 | $1,833 | $100,735 | $11,520 | $89,215 |
| 2015 | $1,853 | $103,405 | $9,600 | $93,805 |
| 2010 | -- | $103,430 | $9,600 | $93,830 |
Source: Public Records
Map
Nearby Homes