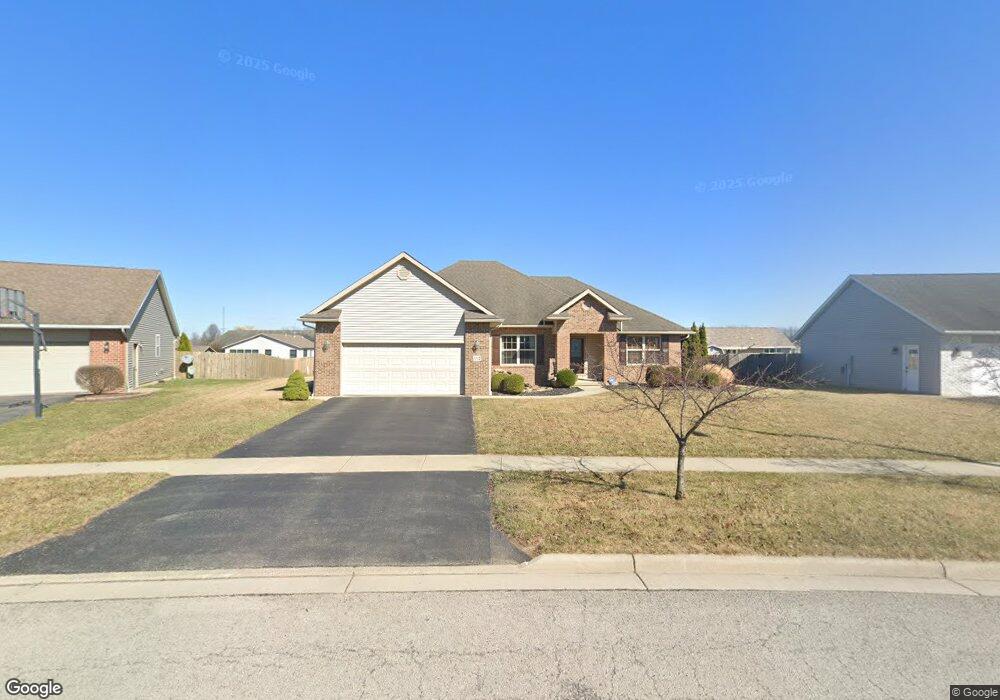
1115 Lye Creek Dr Findlay, OH 45840
Estimated Value: $354,032 - $384,000
3
Beds
2
Baths
1,930
Sq Ft
$189/Sq Ft
Est. Value
About This Home
This home is located at 1115 Lye Creek Dr, Findlay, OH 45840 and is currently estimated at $364,008, approximately $188 per square foot. 1115 Lye Creek Dr is a home located in Hancock County with nearby schools including Wilson Vance Elementary School, Whittier Elementary School, and Donnell Middle School.
Ownership History
Date
Name
Owned For
Owner Type
Purchase Details
Closed on
Sep 6, 2014
Sold by
Selhorst Jeremy J and Dettmer Brandan R
Bought by
Trautman Andrew C
Current Estimated Value
Home Financials for this Owner
Home Financials are based on the most recent Mortgage that was taken out on this home.
Original Mortgage
$150,080
Outstanding Balance
$114,939
Interest Rate
4.15%
Mortgage Type
New Conventional
Estimated Equity
$249,069
Purchase Details
Closed on
Jan 11, 2008
Sold by
Best Roger and Best Nancy J
Bought by
Selhorst Jeremy J and Selhorst Brandan R
Home Financials for this Owner
Home Financials are based on the most recent Mortgage that was taken out on this home.
Original Mortgage
$218,500
Interest Rate
6.13%
Mortgage Type
Purchase Money Mortgage
Create a Home Valuation Report for This Property
The Home Valuation Report is an in-depth analysis detailing your home's value as well as a comparison with similar homes in the area
Home Values in the Area
Average Home Value in this Area
Purchase History
| Date | Buyer | Sale Price | Title Company |
|---|---|---|---|
| Trautman Andrew C | $187,600 | Mid Amer Title Agency Inc | |
| Selhorst Jeremy J | $230,000 | Mid Am Title |
Source: Public Records
Mortgage History
| Date | Status | Borrower | Loan Amount |
|---|---|---|---|
| Open | Trautman Andrew C | $150,080 | |
| Previous Owner | Selhorst Jeremy J | $218,500 |
Source: Public Records
Tax History Compared to Growth
Tax History
| Year | Tax Paid | Tax Assessment Tax Assessment Total Assessment is a certain percentage of the fair market value that is determined by local assessors to be the total taxable value of land and additions on the property. | Land | Improvement |
|---|---|---|---|---|
| 2024 | $3,586 | $100,940 | $16,060 | $84,880 |
| 2023 | $3,998 | $112,380 | $16,060 | $96,320 |
| 2022 | $3,984 | $112,380 | $16,060 | $96,320 |
| 2021 | $3,749 | $92,050 | $16,050 | $76,000 |
| 2020 | $3,746 | $92,050 | $16,050 | $76,000 |
| 2019 | $3,671 | $92,050 | $16,050 | $76,000 |
| 2018 | $3,627 | $83,450 | $11,070 | $72,380 |
| 2017 | $1,814 | $83,450 | $11,070 | $72,380 |
| 2016 | $3,567 | $83,450 | $11,070 | $72,380 |
| 2015 | $3,112 | $71,160 | $11,780 | $59,380 |
| 2014 | $3,112 | $71,160 | $11,780 | $59,380 |
| 2012 | $3,393 | $77,040 | $11,780 | $65,260 |
Source: Public Records
Map
Nearby Homes
- 1802 Lippincott Ave
- 1000 Tarra Oaks Dr
- 1301 Fishlock Ave
- 1037 Fishlock Ave
- 1463 Misty Oaks Dr
- 0 Blanchard Ave
- 1464 Misty Oaks Dr
- 1010 Country Creek Dr
- 1200 5th St
- 1109 Brookside Dr
- 619 Fishlock Ave
- 516 Cranberry W
- 1011 Stall Dr
- 15591 Canadian Way
- 15586 Canadian Way
- 15615 Canadian Way
- 1008 Eastview Dr
- 1006 Selby St
- 820 Selby St
- 1709 Eastview Dr
- 0 Lye Creek Dr
- 1127 Lye Creek Dr
- 1116 Lye Creek Dr
- 1103 Lye Creek Dr
- 1128 Lye Creek Dr
- 1306 Lye Creek Dr
- 1140 Lye Creek Dr
- 1305 1st St
- 1126 Homestead Dr
- 1134 Homestead Dr
- 1151 Lye Creek Dr
- 1142 Homestead Dr
- 1411 Fox Hound Dr
- 1301 1st St
- 1150 Homestead Dr
- 1163 Lye Creek Dr
- 1862 Lippincott Ave
- 1854 Lippincott Ave
- 1419 Fox Hound Dr
- 1844 Lippincott Ave