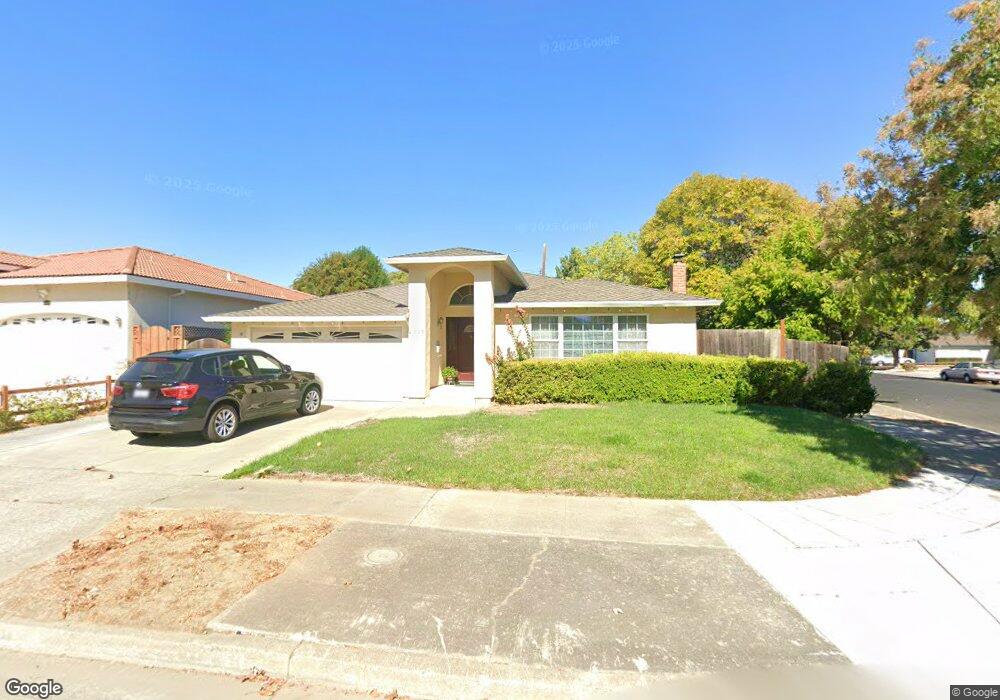
1115 Lynbrook Way San Jose, CA 95129
West San Jose NeighborhoodEstimated Value: $3,172,625 - $3,560,000
4
Beds
3
Baths
1,187
Sq Ft
$2,814/Sq Ft
Est. Value
About This Home
This home is located at 1115 Lynbrook Way, San Jose, CA 95129 and is currently estimated at $3,339,906, approximately $2,813 per square foot. 1115 Lynbrook Way is a home located in Santa Clara County with nearby schools including Nelson S. Dilworth Elementary School, Joaquin Miller Middle, and Lynbrook High School.
Ownership History
Date
Name
Owned For
Owner Type
Purchase Details
Closed on
Apr 11, 2018
Sold by
Ying Xuejun and Lu Chaochin
Bought by
Ying Xuejun and Lu Chaochin
Current Estimated Value
Purchase Details
Closed on
Jun 7, 2010
Sold by
Ying Xuejun
Bought by
Ying Xuejun and Lu Chaochin
Purchase Details
Closed on
Jan 6, 2009
Sold by
Lu Chaochin
Bought by
Ying Xuejun
Home Financials for this Owner
Home Financials are based on the most recent Mortgage that was taken out on this home.
Original Mortgage
$417,000
Outstanding Balance
$274,495
Interest Rate
5.97%
Mortgage Type
New Conventional
Estimated Equity
$3,065,411
Purchase Details
Closed on
Feb 25, 2003
Sold by
Ying Xuejun and Lu Chaochin
Bought by
Ying Xuejun and Lu Chaochin
Home Financials for this Owner
Home Financials are based on the most recent Mortgage that was taken out on this home.
Original Mortgage
$190,000
Interest Rate
5.85%
Purchase Details
Closed on
Jun 26, 2002
Sold by
Ying Xuejun and Lu Chaochin
Bought by
Ying Xuejun and Lu Chaochin
Purchase Details
Closed on
Sep 24, 1996
Sold by
Nardulli Ellen C and Nardulli Maura
Bought by
Ying Xue J and Lu Chao C
Create a Home Valuation Report for This Property
The Home Valuation Report is an in-depth analysis detailing your home's value as well as a comparison with similar homes in the area
Home Values in the Area
Average Home Value in this Area
Purchase History
| Date | Buyer | Sale Price | Title Company |
|---|---|---|---|
| Ying Xuejun | -- | None Available | |
| Ying Xuejun | -- | Accommodation | |
| Ying Xuejun | -- | Fidelity National Title Co | |
| Ying Xuejun | -- | Fidelity National Title Ins | |
| Ying Xuejun | -- | -- | |
| Ying Xuejun | -- | -- | |
| Ying Xue J | $320,000 | Santa Clara Land Title Co |
Source: Public Records
Mortgage History
| Date | Status | Borrower | Loan Amount |
|---|---|---|---|
| Open | Ying Xuejun | $417,000 | |
| Closed | Ying Xuejun | $190,000 |
Source: Public Records
Tax History Compared to Growth
Tax History
| Year | Tax Paid | Tax Assessment Tax Assessment Total Assessment is a certain percentage of the fair market value that is determined by local assessors to be the total taxable value of land and additions on the property. | Land | Improvement |
|---|---|---|---|---|
| 2025 | $8,775 | $626,016 | $325,726 | $300,290 |
| 2024 | $8,775 | $613,742 | $319,340 | $294,402 |
| 2023 | $8,651 | $601,709 | $313,079 | $288,630 |
| 2022 | $8,742 | $589,912 | $306,941 | $282,971 |
| 2021 | $8,589 | $578,346 | $300,923 | $277,423 |
| 2020 | $8,409 | $572,417 | $297,838 | $274,579 |
| 2019 | $8,224 | $561,195 | $291,999 | $269,196 |
| 2018 | $7,997 | $550,192 | $286,274 | $263,918 |
| 2017 | $7,953 | $539,405 | $280,661 | $258,744 |
| 2016 | $7,710 | $528,829 | $275,158 | $253,671 |
| 2015 | $7,657 | $520,886 | $271,025 | $249,861 |
| 2014 | $7,109 | $510,683 | $265,716 | $244,967 |
Source: Public Records
Map
Nearby Homes
- 1018 Huntingdon Dr
- 5688 Kimberly St
- 1154 Bentoak Ln
- 1002 Oaktree Dr
- 10860 Johnson Ave
- 18980 Newsom Ave
- 6117 Brigantine Dr
- 5635 W Walbrook Dr
- 1063 Whitebick Dr
- 1367 Cordelia Ave
- 5187 Doyle Rd
- 915 S Tantau Ave
- 18901 Tuggle Ave
- 18817 Tuggle Ave
- 1055 Happy Valley Ave
- 810 Raintree Dr
- 1017 Craig Dr
- 19251 Phil Ln
- 19220 Tilson Ave
- 18630 Crabtree Ave
- 1117 Lynbrook Way
- 5710 Harder St
- 5720 Harder St
- 1123 Lynbrook Way
- 5730 Harder St
- 1118 Huntingdon Dr
- 1133 Huntingdon Dr
- 1114 Huntingdon Dr
- 1124 Huntingdon Dr
- 1127 Lynbrook Way
- 5740 Harder St
- 1106 Huntingdon Dr
- 1130 Huntingdon Dr
- 1139 Huntingdon Dr
- 1144 Lynbrook Way
- 1102 Huntingdon Dr
- 5750 Harder St
- 1134 Huntingdon Dr
- 1131 Lynbrook Way
- 1097 Huntingdon Dr