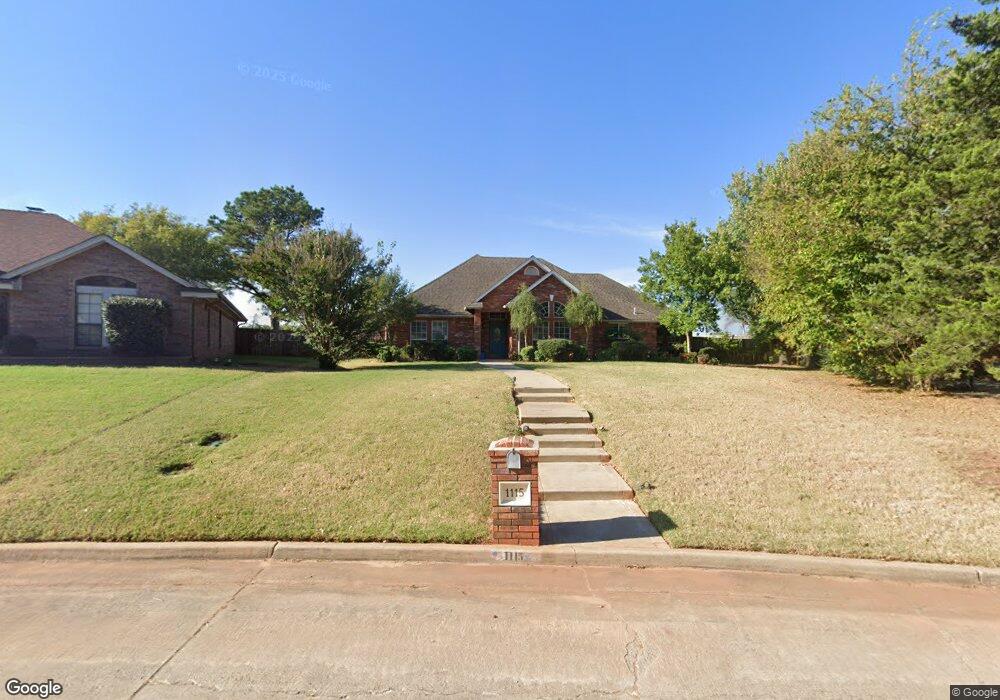
1115 Quail Hollow Shawnee, OK 74804
Estimated Value: $304,000 - $347,144
4
Beds
2
Baths
2,182
Sq Ft
$153/Sq Ft
Est. Value
About This Home
This home is located at 1115 Quail Hollow, Shawnee, OK 74804 and is currently estimated at $333,536, approximately $152 per square foot. 1115 Quail Hollow is a home located in Pottawatomie County.
Ownership History
Date
Name
Owned For
Owner Type
Purchase Details
Closed on
Jul 10, 2015
Sold by
Peterson Linda and Peterson Linda L
Bought by
Needham Terry
Current Estimated Value
Home Financials for this Owner
Home Financials are based on the most recent Mortgage that was taken out on this home.
Original Mortgage
$225,393
Outstanding Balance
$176,055
Interest Rate
3.91%
Mortgage Type
New Conventional
Estimated Equity
$157,481
Purchase Details
Closed on
Jul 9, 2015
Sold by
Peterson Eugene M and Peterson Eugene
Bought by
Peterson Linda and Peterson Linda L
Home Financials for this Owner
Home Financials are based on the most recent Mortgage that was taken out on this home.
Original Mortgage
$225,393
Outstanding Balance
$176,055
Interest Rate
3.91%
Mortgage Type
New Conventional
Estimated Equity
$157,481
Purchase Details
Closed on
Aug 29, 2005
Sold by
Peterson Eugene M and Peterson Linda L
Bought by
Peterson Eugene M and Peterson Linda L
Purchase Details
Closed on
Jun 2, 1997
Sold by
Keller Enterprises
Bought by
Hines James and Cindy Garri
Create a Home Valuation Report for This Property
The Home Valuation Report is an in-depth analysis detailing your home's value as well as a comparison with similar homes in the area
Home Values in the Area
Average Home Value in this Area
Purchase History
| Date | Buyer | Sale Price | Title Company |
|---|---|---|---|
| Needham Terry | $221,000 | First American Title | |
| Peterson Linda | -- | First American Title & Tr Co | |
| Peterson Eugene M | -- | None Available | |
| Hines James | $19,000 | -- |
Source: Public Records
Mortgage History
| Date | Status | Borrower | Loan Amount |
|---|---|---|---|
| Open | Needham Terry | $225,393 |
Source: Public Records
Tax History Compared to Growth
Tax History
| Year | Tax Paid | Tax Assessment Tax Assessment Total Assessment is a certain percentage of the fair market value that is determined by local assessors to be the total taxable value of land and additions on the property. | Land | Improvement |
|---|---|---|---|---|
| 2024 | $2,514 | $28,278 | $4,200 | $24,078 |
| 2023 | $2,514 | $27,454 | $4,200 | $23,254 |
| 2022 | $2,467 | $27,454 | $4,200 | $23,254 |
| 2021 | $2,489 | $27,454 | $4,200 | $23,254 |
| 2020 | $2,539 | $28,030 | $4,200 | $23,830 |
| 2019 | $2,597 | $28,339 | $4,200 | $24,139 |
| 2018 | $2,551 | $27,705 | $4,200 | $23,505 |
| 2017 | $2,493 | $27,315 | $4,200 | $23,115 |
| 2016 | $2,444 | $26,520 | $4,200 | $22,320 |
| 2015 | $1,696 | $21,051 | $3,012 | $18,039 |
| 2014 | $1,644 | $20,439 | $2,280 | $18,159 |
Source: Public Records
Map
Nearby Homes
- 1208 E Rose Dr
- 31 E Oak Hill
- 1206 Monroe Dr
- 2001 N Mckinley Ave
- 1219 E Monroe Dr
- 17 Beckley St
- 1406 E Bradley St
- 1210 E Independence St
- 27 N Rice Ave
- 1712 N Pennsylvania Ave
- 9 Dustin Cir
- 40 Northridge Rd
- 806 E Midland St
- 1301 E Independence St
- 2024 Lantana Cir
- 2304 N Tucker Ave
- 23 Crown Point
- 0 Independence and Minnesota St
- 1202 Mark St
- 1410 Laverne Ave
- 1119 Quail Hollow
- 1116 Quail Hollow Rd
- 1116 Quail Hollow
- 1111 Quail Hollow
- 1123 Quail Hollow
- 1107 Quail Hollow Rd
- 1120 Quail Hollow
- 1113 Quail Hollow Rd
- 1125 Quail Hollow
- 916 E Cammack St
- 1108 Quail Hollow
- 1101 E Cammack Cir
- 1127 Quail Hollow
- 1124 Quail Hollow
- 1129 Quail Hollow
- 1107 Quail Hollow
- 910 E Cammack
- 1106 Quail Hollow
- 1131 Quail Hollow
- 1910 Keller Place