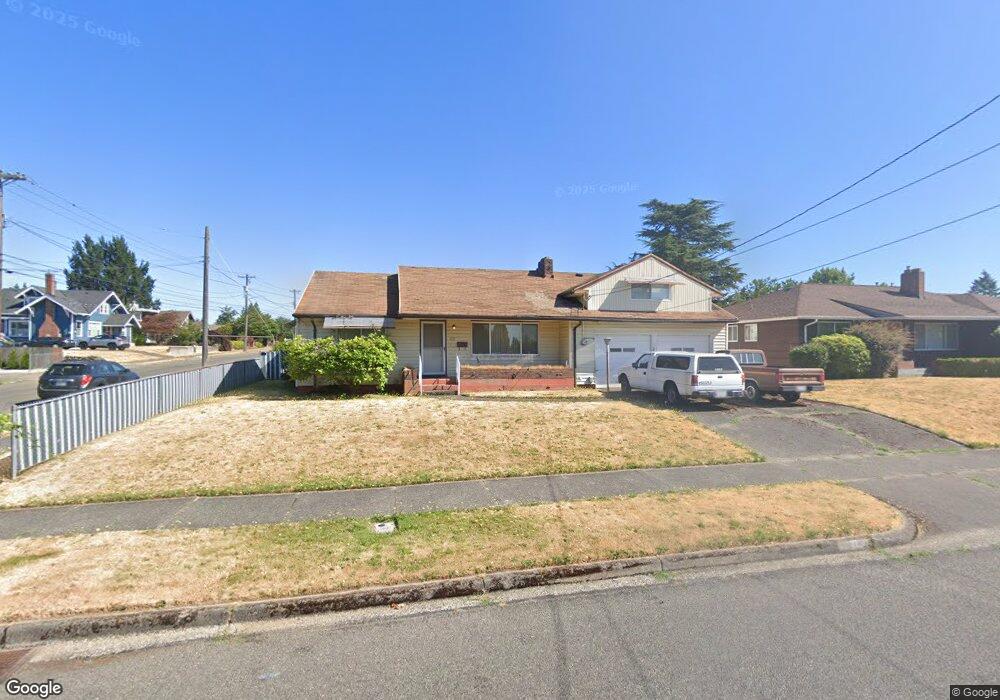
1115 S 68th St Tacoma, WA 98408
South End NeighborhoodEstimated Value: $378,000 - $520,000
2
Beds
2
Baths
1,588
Sq Ft
$270/Sq Ft
Est. Value
About This Home
This home is located at 1115 S 68th St, Tacoma, WA 98408 and is currently estimated at $429,147, approximately $270 per square foot. 1115 S 68th St is a home located in Pierce County with nearby schools including Oakland High School, Angelo Giaudrone Middle School, and Mount Tahoma High School.
Ownership History
Date
Name
Owned For
Owner Type
Purchase Details
Closed on
Jul 15, 1998
Sold by
Sherman Patrick J
Bought by
Kaup Daniel T
Current Estimated Value
Home Financials for this Owner
Home Financials are based on the most recent Mortgage that was taken out on this home.
Original Mortgage
$121,250
Outstanding Balance
$24,813
Interest Rate
7%
Estimated Equity
$404,334
Purchase Details
Closed on
Nov 18, 1996
Sold by
Flateland Robert K
Bought by
Sherman Patrick J
Home Financials for this Owner
Home Financials are based on the most recent Mortgage that was taken out on this home.
Original Mortgage
$75,000
Interest Rate
7.91%
Purchase Details
Closed on
Jul 24, 1995
Sold by
Aurdal Oddvar and Hale Oddwin A
Bought by
Flateland Robert K
Home Financials for this Owner
Home Financials are based on the most recent Mortgage that was taken out on this home.
Original Mortgage
$80,000
Interest Rate
5.37%
Create a Home Valuation Report for This Property
The Home Valuation Report is an in-depth analysis detailing your home's value as well as a comparison with similar homes in the area
Home Values in the Area
Average Home Value in this Area
Purchase History
| Date | Buyer | Sale Price | Title Company |
|---|---|---|---|
| Kaup Daniel T | $145,424 | Washington Title Company | |
| Sherman Patrick J | $122,156 | Rainier Title Company | |
| Flateland Robert K | $116,339 | -- |
Source: Public Records
Mortgage History
| Date | Status | Borrower | Loan Amount |
|---|---|---|---|
| Open | Kaup Daniel T | $121,250 | |
| Previous Owner | Sherman Patrick J | $75,000 | |
| Previous Owner | Flateland Robert K | $80,000 |
Source: Public Records
Tax History Compared to Growth
Tax History
| Year | Tax Paid | Tax Assessment Tax Assessment Total Assessment is a certain percentage of the fair market value that is determined by local assessors to be the total taxable value of land and additions on the property. | Land | Improvement |
|---|---|---|---|---|
| 2025 | $3,899 | $386,300 | $214,000 | $172,300 |
| 2024 | $3,899 | $382,100 | $206,600 | $175,500 |
| 2023 | $3,899 | $350,000 | $193,700 | $156,300 |
| 2022 | $3,884 | $405,900 | $193,000 | $212,900 |
| 2021 | $3,498 | $278,100 | $112,100 | $166,000 |
| 2019 | $2,974 | $252,300 | $93,700 | $158,600 |
| 2018 | $3,240 | $228,600 | $78,100 | $150,500 |
| 2017 | $2,819 | $205,000 | $63,500 | $141,500 |
| 2016 | $2,472 | $155,400 | $47,600 | $107,800 |
| 2014 | $2,260 | $142,100 | $42,600 | $99,500 |
| 2013 | $2,260 | $129,700 | $40,000 | $89,700 |
Source: Public Records
Map
Nearby Homes
- 6202 S Sheridan Ave
- 5440 S K St
- 7645 S K St
- 1119 S 64th St Unit St
- 6827 S Thompson Ave
- 7021 S I St
- 6329 S J St
- 861 S 72nd St
- 6312 S I St
- 6507 Yakima Ave
- 6826 S Park Ave
- 7002 Park Ave S
- 7233 S Sheridan Ave
- 6819 S Park Ave
- 7420 S J St
- 807 S 74th St
- 7515 S M St
- 6124 S Park Ave
- 1 Fawcett Ave
- 7322 S Alaska St