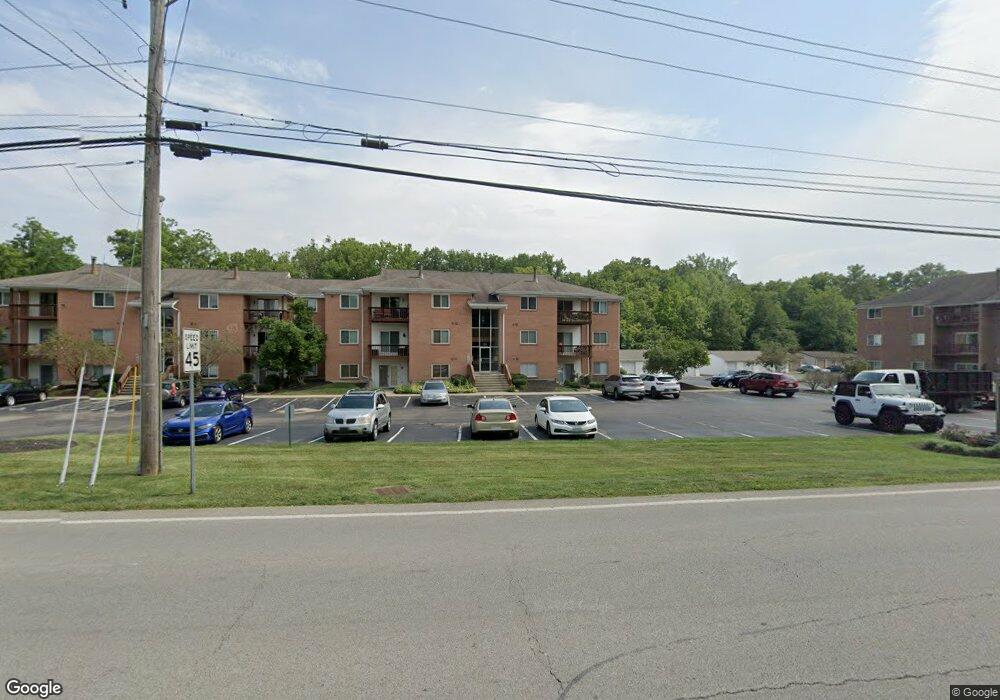
1115 Shayler Rd Unit 24 Batavia, OH 45103
Estimated Value: $153,000 - $161,597
2
Beds
2
Baths
1,127
Sq Ft
$140/Sq Ft
Est. Value
About This Home
This home is located at 1115 Shayler Rd Unit 24, Batavia, OH 45103 and is currently estimated at $157,649, approximately $139 per square foot. 1115 Shayler Rd Unit 24 is a home located in Clermont County with nearby schools including Clough Pike Elementary School, West Clermont Middle School, and West Clermont High School.
Ownership History
Date
Name
Owned For
Owner Type
Purchase Details
Closed on
May 17, 2019
Sold by
Fraley Linda L
Bought by
Hartness Jeffery S and Hartness Betty
Current Estimated Value
Purchase Details
Closed on
Apr 19, 2017
Sold by
Fraley Linda L
Bought by
Fraley Linda L
Purchase Details
Closed on
May 4, 2012
Sold by
Federal Home Loan Mortgage Corporation
Bought by
Blas Maria S and Blas Roke B
Purchase Details
Closed on
Feb 7, 2012
Sold by
Ritter Anthony C
Bought by
Federal Home Loan Mortgage Corporation
Purchase Details
Closed on
May 28, 2004
Sold by
Ritter Albert G and Ritter Lois M
Bought by
Ritter Anthony C
Home Financials for this Owner
Home Financials are based on the most recent Mortgage that was taken out on this home.
Original Mortgage
$76,000
Interest Rate
4.37%
Mortgage Type
Unknown
Purchase Details
Closed on
May 10, 1991
Create a Home Valuation Report for This Property
The Home Valuation Report is an in-depth analysis detailing your home's value as well as a comparison with similar homes in the area
Home Values in the Area
Average Home Value in this Area
Purchase History
| Date | Buyer | Sale Price | Title Company |
|---|---|---|---|
| Hartness Jeffery S | $84,900 | None Available | |
| Fraley Linda L | -- | None Available | |
| Blas Maria S | $47,500 | Attorney | |
| Federal Home Loan Mortgage Corporation | $43,334 | None Available | |
| Ritter Anthony C | $80,000 | -- | |
| -- | $59,400 | -- |
Source: Public Records
Mortgage History
| Date | Status | Borrower | Loan Amount |
|---|---|---|---|
| Previous Owner | Ritter Anthony C | $76,000 |
Source: Public Records
Tax History
| Year | Tax Paid | Tax Assessment Tax Assessment Total Assessment is a certain percentage of the fair market value that is determined by local assessors to be the total taxable value of land and additions on the property. | Land | Improvement |
|---|---|---|---|---|
| 2024 | $1,589 | $41,310 | $6,410 | $34,900 |
| 2023 | $1,623 | $41,310 | $6,410 | $34,900 |
| 2022 | $1,071 | $27,130 | $4,200 | $22,930 |
| 2021 | $1,075 | $27,130 | $4,200 | $22,930 |
| 2020 | $1,076 | $27,130 | $4,200 | $22,930 |
| 2019 | $759 | $14,740 | $2,000 | $12,740 |
| 2018 | $766 | $14,740 | $2,000 | $12,740 |
| 2017 | $307 | $14,740 | $2,000 | $12,740 |
| 2016 | $728 | $13,020 | $1,750 | $11,270 |
| 2015 | $706 | $13,020 | $1,750 | $11,270 |
| 2014 | $706 | $13,020 | $1,750 | $11,270 |
| 2013 | $914 | $16,670 | $1,510 | $15,160 |
Source: Public Records
Map
Nearby Homes
- 1090 Ridgepointe Dr
- 1161 Abbott Rd
- 4250 English Oaks Ct
- 1166 Creekstone Dr
- 1194 Meadow Knoll Ct
- 1202 Meadow Knoll Ct
- 966 London Ct
- 4181 Sagewood Ct
- 4166 Keller Ct
- 1211 Parkside Dr
- 4174 Shayler Creek Dr
- 1069 Crisfield Dr
- 4004 Silverstone Ln
- 4074 Woodsly Dr
- 4125 Beamer Ct
- 1079 Kensington Ln
- 1237 Traction Rd
- 1332 Granite Dr
- 4028 Silverstone Ln
- 4234 Pheasant Hollow
- 1115 Shayler Rd
- 1115 Shayler Rd
- 1115 Shayler Rd Unit 30
- 1115 Shayler Rd
- 1115 Shayler Rd
- 1115 Shayler Rd Unit 27
- 1115 Shayler Rd Unit 26
- 1115 Shayler Rd Unit 25
- 1115 Shayler Rd
- 1115 Shayler Rd
- 1115 Shayler Rd
- 1115 Shayler Rd Unit 31
- 1115 Shayler Rd Unit 24
- 1115 Shayler Rd Unit 22
- 1115 Shayler Rd Unit 23
- 1115 Shayler Rd Unit 29
- 1115 Shayler Rd Unit 21
- 1119 Shayler Rd Unit 43
- 1119 Shayler Rd Unit 42
- 1119 Shayler Rd
Your Personal Tour Guide
Ask me questions while you tour the home.