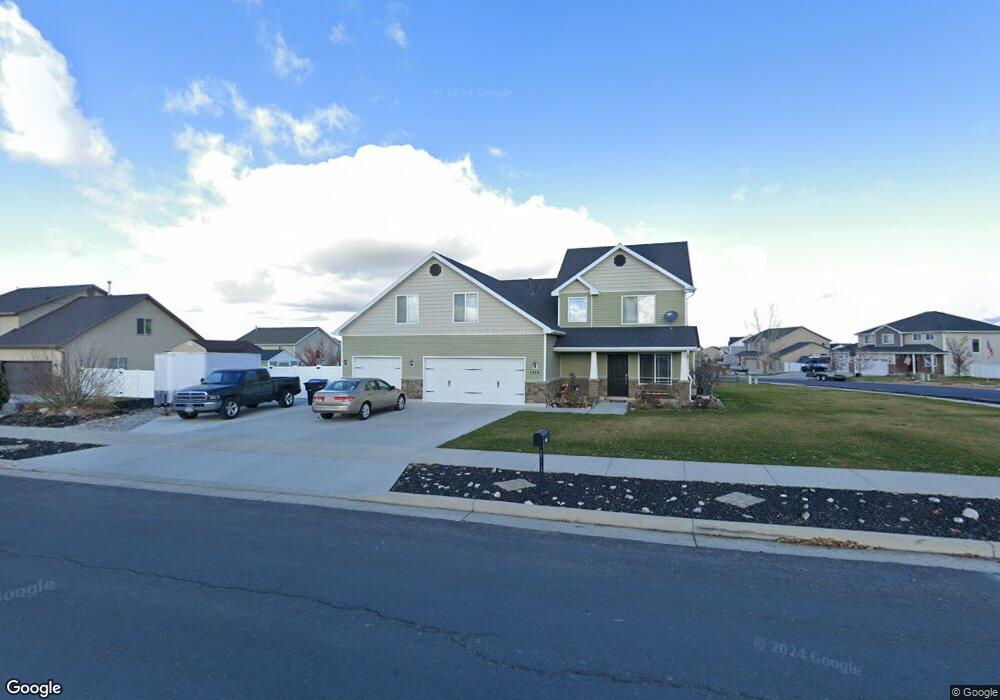
1115 W 2600 S Unit 98 Nibley, UT 84321
Estimated Value: $546,000 - $628,000
--
Bed
--
Bath
2,524
Sq Ft
$229/Sq Ft
Est. Value
About This Home
This home is located at 1115 W 2600 S Unit 98, Nibley, UT 84321 and is currently estimated at $577,061, approximately $228 per square foot. 1115 W 2600 S Unit 98 is a home located in Cache County with nearby schools including Nibley School, Spring Creek Middle School, and South Cache Middle School.
Ownership History
Date
Name
Owned For
Owner Type
Purchase Details
Closed on
Nov 20, 2012
Sold by
Sierra Homes Construction Inc
Bought by
Avila Armando and Avila Fara
Current Estimated Value
Home Financials for this Owner
Home Financials are based on the most recent Mortgage that was taken out on this home.
Original Mortgage
$190,315
Outstanding Balance
$130,316
Interest Rate
3.35%
Mortgage Type
New Conventional
Estimated Equity
$446,745
Purchase Details
Closed on
May 17, 2012
Sold by
Horizon Enterprises Inc
Bought by
Sierra Homes Construction Inc
Home Financials for this Owner
Home Financials are based on the most recent Mortgage that was taken out on this home.
Original Mortgage
$45,000
Interest Rate
10%
Mortgage Type
Purchase Money Mortgage
Create a Home Valuation Report for This Property
The Home Valuation Report is an in-depth analysis detailing your home's value as well as a comparison with similar homes in the area
Home Values in the Area
Average Home Value in this Area
Purchase History
| Date | Buyer | Sale Price | Title Company |
|---|---|---|---|
| Avila Armando | -- | Northern Title Company | |
| Sierra Homes Construction Inc | -- | Northern Title Company |
Source: Public Records
Mortgage History
| Date | Status | Borrower | Loan Amount |
|---|---|---|---|
| Open | Avila Armando | $190,315 | |
| Previous Owner | Sierra Homes Construction Inc | $45,000 |
Source: Public Records
Tax History Compared to Growth
Tax History
| Year | Tax Paid | Tax Assessment Tax Assessment Total Assessment is a certain percentage of the fair market value that is determined by local assessors to be the total taxable value of land and additions on the property. | Land | Improvement |
|---|---|---|---|---|
| 2025 | $2,510 | $332,695 | $0 | $0 |
| 2024 | $2,658 | $330,845 | $0 | $0 |
| 2023 | $2,777 | $323,620 | $0 | $0 |
| 2022 | $2,891 | $323,620 | $0 | $0 |
| 2021 | $2,135 | $371,155 | $69,300 | $301,855 |
| 2020 | $2,004 | $331,783 | $69,300 | $262,483 |
| 2019 | $2,102 | $331,783 | $69,300 | $262,483 |
| 2018 | $1,853 | $285,360 | $51,000 | $234,360 |
| 2017 | $1,849 | $150,810 | $0 | $0 |
| 2016 | $1,870 | $128,590 | $0 | $0 |
| 2015 | $1,550 | $125,840 | $0 | $0 |
| 2014 | $1,515 | $125,840 | $0 | $0 |
| 2013 | $616 | $130,910 | $0 | $0 |
Source: Public Records
Map
Nearby Homes
- 2485 S 1296 W
- 1045 W 2400 S
- 2616 S 900 W
- 2814 S 1150 W
- 1254 W 2401 S
- 2301 S 1050 W
- 2301 S 1050 W Unit 99
- 2313 S 1000 W Unit 110
- 2313 S 1000 W
- 2882 S 1080 W
- 1140 2260 S
- 2271 S 1050 W
- 2271 S 1050 W Unit 96
- 2237 S 1150 W Unit 39
- 2206 S 1120 W Unit 65
- 2206 S 1120 W
- 3074 S 800 W
- Alpine Plan at Firefly Estates - Single Family
- Monroe Plan at Firefly Estates - Single Family
- Gala Plan at Firefly Estates - Single Family
- 1115 W 2600 S
- 1133 W 2600 S Unit 99
- 1133 W 2600 S
- 2565 S 1100 W
- 1126 W 2600 S
- 2580 S 1100 W
- 2570 S 1100 W
- 1136 W 2550 S
- 1136 W 2550 S Unit 96
- 1149 W 2600 S Unit 100
- 1149 W 2600 S
- 2560 S 1100 W
- 1144 W 2600 S
- 1127 W 2640 S
- 1152 W 2550 S
- 1152 W 2550 S Unit 95
- 1129 W 2550 S Unit 89
- 1070 W 2600 S
- 1065 W 2600 S
- 1145 W 2640 S