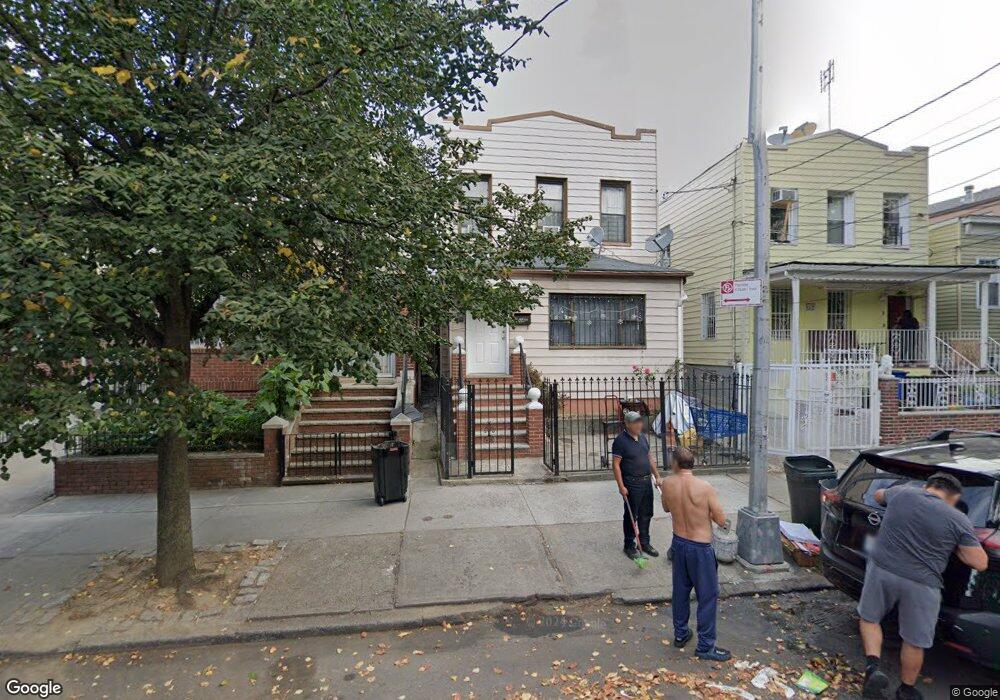
11151 41st Ave Corona, NY 11368
Corona NeighborhoodEstimated Value: $863,183 - $1,213,000
--
Bed
--
Bath
1,908
Sq Ft
$580/Sq Ft
Est. Value
About This Home
This home is located at 11151 41st Ave, Corona, NY 11368 and is currently estimated at $1,106,296, approximately $579 per square foot. 11151 41st Ave is a home located in Queens County with nearby schools including P.S. 143 Louis Armstrong, Is 61 Leonardo Da Vinci, and Flushing High School.
Ownership History
Date
Name
Owned For
Owner Type
Purchase Details
Closed on
Jul 10, 2007
Sold by
Gavilanez Jose M and Gavilanez Nixon P
Bought by
Gavilanez Jose M and Gavilanez Maria A
Current Estimated Value
Purchase Details
Closed on
May 28, 2004
Sold by
Gavilanez Nixon P
Bought by
Gavilanez Jose M and Gavilanez Nixon P
Purchase Details
Closed on
Nov 15, 2002
Sold by
Gavilanes and Gavilanes
Bought by
Gavilanez Nixon
Purchase Details
Closed on
Mar 27, 1997
Sold by
Veras Pedro
Bought by
Gavilanes Jose
Home Financials for this Owner
Home Financials are based on the most recent Mortgage that was taken out on this home.
Original Mortgage
$237,500
Outstanding Balance
$29,663
Interest Rate
7.5%
Estimated Equity
$1,076,633
Create a Home Valuation Report for This Property
The Home Valuation Report is an in-depth analysis detailing your home's value as well as a comparison with similar homes in the area
Home Values in the Area
Average Home Value in this Area
Purchase History
| Date | Buyer | Sale Price | Title Company |
|---|---|---|---|
| Gavilanez Jose M | -- | -- | |
| Gavilanez Jose M | -- | -- | |
| Gavilanez Jose M | -- | -- | |
| Gavilanez Jose M | -- | -- | |
| Gavilanez Nixon | -- | -- | |
| Gavilanez Nixon | -- | -- | |
| Gavilanes Jose | $250,000 | First American Title Ins Co | |
| Gavilanes Jose | $250,000 | First American Title Ins Co |
Source: Public Records
Mortgage History
| Date | Status | Borrower | Loan Amount |
|---|---|---|---|
| Open | Gavilanes Jose | $237,500 | |
| Closed | Gavilanes Jose | $237,500 |
Source: Public Records
Tax History Compared to Growth
Tax History
| Year | Tax Paid | Tax Assessment Tax Assessment Total Assessment is a certain percentage of the fair market value that is determined by local assessors to be the total taxable value of land and additions on the property. | Land | Improvement |
|---|---|---|---|---|
| 2025 | $7,168 | $37,763 | $6,221 | $31,542 |
| 2024 | $7,168 | $35,686 | $5,612 | $30,074 |
| 2023 | $6,822 | $33,966 | $5,083 | $28,883 |
| 2022 | $6,437 | $64,080 | $10,200 | $53,880 |
| 2021 | $6,786 | $58,140 | $10,200 | $47,940 |
| 2020 | $6,661 | $54,180 | $10,200 | $43,980 |
| 2019 | $6,221 | $59,700 | $10,200 | $49,500 |
| 2018 | $5,770 | $28,305 | $6,399 | $21,906 |
| 2017 | $5,478 | $26,872 | $6,621 | $20,251 |
| 2016 | $5,372 | $26,872 | $6,621 | $20,251 |
| 2015 | $3,058 | $26,224 | $9,387 | $16,837 |
| 2014 | $3,058 | $24,782 | $10,227 | $14,555 |
Source: Public Records
Map
Nearby Homes
- 11149 41st Ave
- 11214 Roosevelt Ave
- 11187 41st Ave
- 111-73 43rd Ave
- 31-15 102 St
- 41-08 111th St
- 38-12 114th St
- 112-50 38th Ave
- 111-16 43rd Ave
- 112-01 38th Ave
- 43-10 111th St
- 10844 41st Ave
- 10842 41st Ave
- 108-38 41st Ave Unit 1A
- 108-38 41st Ave Unit 4A
- 10849 43rd Ave
- 37-17 111th St Unit 5B
- 111-15 37th Ave
- 108-20 38th Ave
- 4211 108th St Unit 1A
- 11153 41st Ave
- 111-57 41st Ave
- 11147 41st Ave
- 11157 41st Ave
- 111-59 41st Ave
- 11159 41st Ave
- 111-43 41st Ave
- 11143 41st Ave
- 11141 41st Ave
- 11161 41st Ave
- 11212 Roosevelt Ave
- 11218 Roosevelt Ave
- 11210 Roosevelt Ave
- 11139 41st Ave
- 11208 Roosevelt Ave
- 11165 41st Ave
- 11204 Roosevelt Ave
- 111-50 41st Ave Unit 3
- 111-50 41st Ave
- 111-50 41st Ave Unit 2