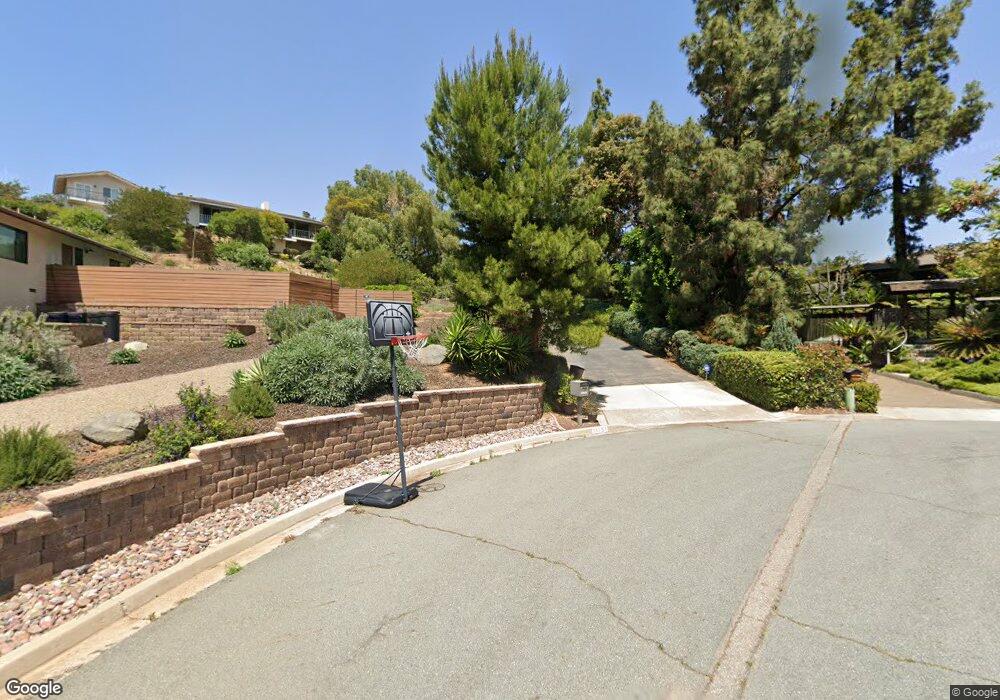
11151 Shining Light Way El Cajon, CA 92020
Estimated Value: $1,219,000 - $1,368,000
4
Beds
3
Baths
2,511
Sq Ft
$519/Sq Ft
Est. Value
About This Home
This home is located at 11151 Shining Light Way, El Cajon, CA 92020 and is currently estimated at $1,303,607, approximately $519 per square foot. 11151 Shining Light Way is a home located in San Diego County with nearby schools including Fuerte Elementary School, Hillsdale Middle School, and Valhalla High.
Ownership History
Date
Name
Owned For
Owner Type
Purchase Details
Closed on
May 28, 2012
Sold by
Schriefer Theodore W
Bought by
Schriefer Theodore W
Current Estimated Value
Purchase Details
Closed on
Feb 21, 2008
Sold by
Schriefer Theodore William and Schriefer Charlotte I
Bought by
Schriefer Theodore W and Schriefer Charlotte I
Purchase Details
Closed on
May 10, 2000
Sold by
Schriefer Theodore W
Bought by
Schriefer Theodore W and Theodore W Schriefer Trust
Purchase Details
Closed on
Apr 19, 2000
Sold by
Schriefer Edna A
Bought by
Schriefer Edna A and Edna A Schriefer Family Trust
Purchase Details
Closed on
Apr 12, 2000
Sold by
Schriefer Charlotte I
Bought by
Schriefer Charlotte I and Charlotte I Schriefer Trust
Purchase Details
Closed on
Nov 1, 1994
Sold by
Grant Arthur W
Bought by
Schriefer Edna A and Schriefer Charlotte I
Purchase Details
Closed on
Sep 24, 1993
Sold by
Grant Arthur W and Grant Betty Lorraine
Bought by
Grant Arthur W and Grant Betty Lorraine
Create a Home Valuation Report for This Property
The Home Valuation Report is an in-depth analysis detailing your home's value as well as a comparison with similar homes in the area
Home Values in the Area
Average Home Value in this Area
Purchase History
| Date | Buyer | Sale Price | Title Company |
|---|---|---|---|
| Schriefer Theodore W | -- | None Available | |
| Schriefer Theodore W | -- | None Available | |
| Schriefer Theodore W | -- | -- | |
| Schriefer Edna A | -- | -- | |
| Schriefer Charlotte I | -- | -- | |
| Schriefer Edna A | $283,000 | Chicago Title Company | |
| Grant Arthur W | -- | -- |
Source: Public Records
Tax History Compared to Growth
Tax History
| Year | Tax Paid | Tax Assessment Tax Assessment Total Assessment is a certain percentage of the fair market value that is determined by local assessors to be the total taxable value of land and additions on the property. | Land | Improvement |
|---|---|---|---|---|
| 2025 | $6,595 | $563,719 | $216,221 | $347,498 |
| 2024 | $6,595 | $552,667 | $211,982 | $340,685 |
| 2023 | $6,423 | $541,831 | $207,826 | $334,005 |
| 2022 | $6,321 | $531,207 | $203,751 | $327,456 |
| 2021 | $6,233 | $520,792 | $199,756 | $321,036 |
| 2020 | $6,164 | $515,453 | $197,708 | $317,745 |
| 2019 | $6,085 | $505,347 | $193,832 | $311,515 |
| 2018 | $5,985 | $495,439 | $190,032 | $305,407 |
| 2017 | $5,907 | $485,725 | $186,306 | $299,419 |
| 2016 | $5,670 | $476,202 | $182,653 | $293,549 |
| 2015 | $5,640 | $469,050 | $179,910 | $289,140 |
| 2014 | -- | $459,863 | $176,386 | $283,477 |
Source: Public Records
Map
Nearby Homes
- 4726 Lorena Place
- 11651 Shadowglen Rd
- 11656 Altoona Dr
- 11201 Constellation Dr
- 11724 Shadow Valley Rd
- 11228 Horizon Hills Dr
- 11231 Culver Ct
- 10979 Skywood Dr
- 11078 Puebla Dr
- 243 Horizon Hills Dr
- 5346 Grandridge Rd
- 182 Dewitt Ct
- 1135 Old Chase Ave
- 12218 Fuerte Dr
- 10880 Hess Dr
- 4620 Panchoy Dr
- 4511 Taft Ave
- 768 E Chase Ave
- 1682 Grove Rd
- 11355 Vista de Bonita Canada
- 11149 Shining Light Way
- 5123 New Ranch Rd
- 11155 Valley Lights Dr
- 4850 Sunrise Valley Dr
- 4838 Sunrise Valley Dr
- 5135 New Ranch Rd
- 5111 New Ranch Rd
- 11153 Valley Lights Dr
- 4862 Sunrise Valley Dr
- 4826 Sunrise Valley Dr
- 11147 Shining Light Way
- 4874 Sunrise Valley Dr
- 4814 Sunrise Valley Dr
- 5118 New Ranch Rd
- 5138 New Ranch Rd
- 5128 New Ranch Rd
- 11154 Valley Lights Dr
- 11160 Valley Lights Dr
- 4837 Sunrise Valley Dr
- 4849 Sunrise Valley Dr