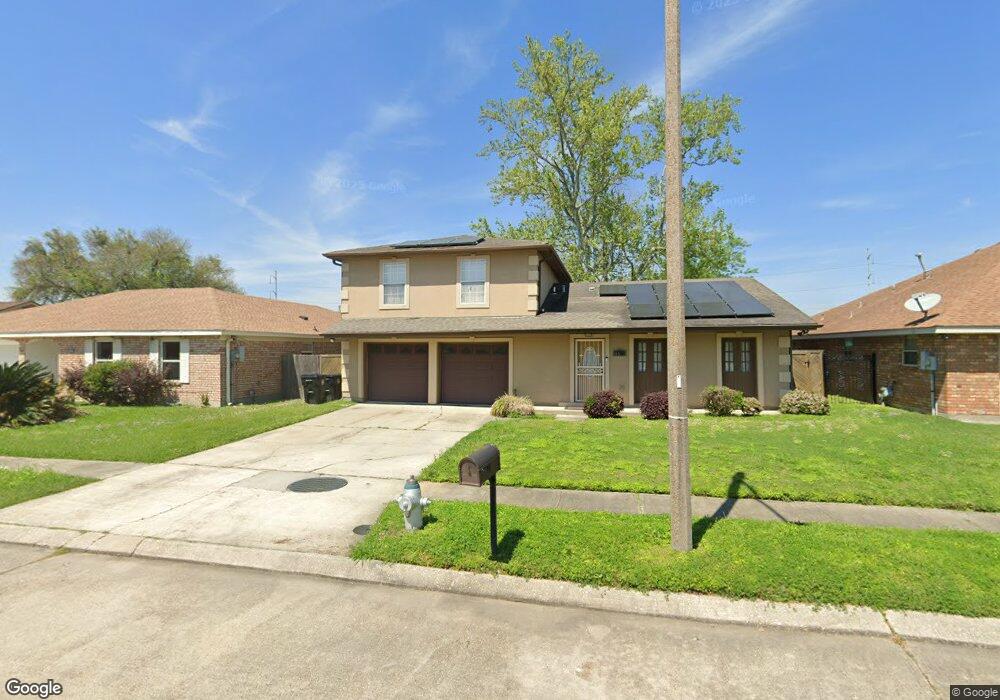
11151 Whiteside Rd New Orleans, LA 70128
Little Woods NeighborhoodEstimated Value: $228,000 - $397,785
4
Beds
3
Baths
2,313
Sq Ft
$121/Sq Ft
Est. Value
About This Home
This home is located at 11151 Whiteside Rd, New Orleans, LA 70128 and is currently estimated at $280,446, approximately $121 per square foot. 11151 Whiteside Rd is a home located in Orleans Parish with nearby schools including ReNEW Dolores T. Aaron Academy, Renew Schaumburg Elementary School, and Einstein Charter School - Village De L'est Elementary.
Ownership History
Date
Name
Owned For
Owner Type
Purchase Details
Closed on
Aug 7, 2009
Sold by
Chrisna Inc
Bought by
Collins Elisha
Current Estimated Value
Home Financials for this Owner
Home Financials are based on the most recent Mortgage that was taken out on this home.
Original Mortgage
$181,649
Outstanding Balance
$118,853
Interest Rate
5.44%
Estimated Equity
$161,593
Purchase Details
Closed on
Mar 26, 2009
Sold by
Residntl Funding Real Est
Bought by
Chrisna Inc
Purchase Details
Closed on
Mar 20, 2009
Sold by
Homecomings Financial Llc
Bought by
Residntl Funding Real Est Hold
Purchase Details
Closed on
Dec 6, 2006
Sold by
Perkins Annette S
Bought by
Dennis Rodney
Home Financials for this Owner
Home Financials are based on the most recent Mortgage that was taken out on this home.
Original Mortgage
$104,000
Interest Rate
8.44%
Mortgage Type
Adjustable Rate Mortgage/ARM
Create a Home Valuation Report for This Property
The Home Valuation Report is an in-depth analysis detailing your home's value as well as a comparison with similar homes in the area
Home Values in the Area
Average Home Value in this Area
Purchase History
| Date | Buyer | Sale Price | Title Company |
|---|---|---|---|
| Collins Elisha | $185,000 | -- | |
| Chrisna Inc | $56,000 | -- | |
| Residntl Funding Real Est Hold | -- | -- | |
| Dennis Rodney | $130,000 | -- |
Source: Public Records
Mortgage History
| Date | Status | Borrower | Loan Amount |
|---|---|---|---|
| Open | Collins Elisha | $181,649 | |
| Closed | Collins Elisha | $181,649 | |
| Previous Owner | Dennis Rodney | $26,000 | |
| Previous Owner | Dennis Rodney | $104,000 |
Source: Public Records
Tax History Compared to Growth
Tax History
| Year | Tax Paid | Tax Assessment Tax Assessment Total Assessment is a certain percentage of the fair market value that is determined by local assessors to be the total taxable value of land and additions on the property. | Land | Improvement |
|---|---|---|---|---|
| 2025 | $1,598 | $16,300 | $2,160 | $14,140 |
| 2024 | $1,615 | $16,300 | $2,160 | $14,140 |
| 2023 | $1,823 | $18,110 | $1,440 | $16,670 |
| 2022 | $1,823 | $17,280 | $1,440 | $15,840 |
| 2021 | $1,975 | $18,110 | $1,440 | $16,670 |
| 2020 | $1,990 | $18,110 | $1,440 | $16,670 |
| 2019 | $2,050 | $18,110 | $2,160 | $15,950 |
| 2018 | $2,082 | $18,110 | $2,160 | $15,950 |
| 2017 | $1,989 | $18,110 | $2,160 | $15,950 |
| 2016 | $2,039 | $18,110 | $2,160 | $15,950 |
| 2015 | $2,064 | $18,500 | $2,160 | $16,340 |
| 2014 | -- | $18,500 | $2,160 | $16,340 |
| 2013 | -- | $18,500 | $2,160 | $16,340 |
Source: Public Records
Map
Nearby Homes
- 11120 Morrison Rd
- 11041 Willowbrae Dr
- 11030 Willowbrae Dr
- 7231 Lake Barrington Dr
- 7524 Michigan St
- 7612 Marquis St
- 11051 Yardley Rd
- 7140 Camberley Dr
- 7625 Lehigh St
- 41374 Curran Blvd
- 7325 Mercier St
- 7569 Lady Gray St
- 7649 Berg St
- 10922 Curran St
- 10921 Roger Dr
- 11010 Roger Dr
- 7119 Northgate Dr
- 10821 Roger Dr
- 7112 Barrington Ct
- 7638 Lady Gray St
- 11141 Whiteside Rd
- 11201 Whiteside Rd
- 11211 Whiteside Rd
- 11150 Morrison Rd
- 11200 Morrison Rd
- 11140 Morrison Rd
- 11150 Whiteside Rd
- 11131 Whiteside Rd
- 11210 Morrison Rd
- 11130 Morrison Rd
- 11200 Whiteside Rd
- 11140 Whiteside Rd
- 11210 Whiteside Rd
- 11130 Whiteside Rd
- 11121 Whiteside Rd
- 11220 Morrison Rd
- 11221 Whiteside Rd
- 11120 Whiteside Rd
- 11220 Whiteside Rd
- 11111 Whiteside Rd