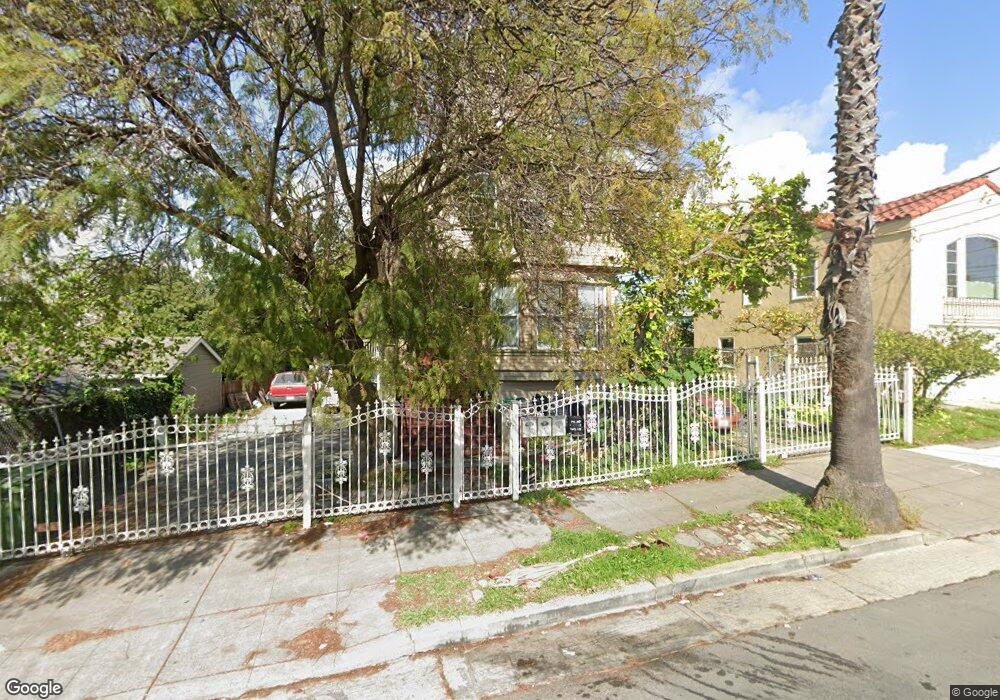
1116 E 21st St Oakland, CA 94606
Clinton NeighborhoodEstimated Value: $671,000 - $750,543
3
Beds
3
Baths
1,948
Sq Ft
$364/Sq Ft
Est. Value
About This Home
This home is located at 1116 E 21st St, Oakland, CA 94606 and is currently estimated at $709,636, approximately $364 per square foot. 1116 E 21st St is a home located in Alameda County with nearby schools including Bella Vista Elementary School, Roosevelt Middle School, and Oakland High School.
Ownership History
Date
Name
Owned For
Owner Type
Purchase Details
Closed on
Apr 24, 2006
Sold by
Dang Cong Phon
Bought by
Cam Dang Cong Phon and Cam Van Dang
Current Estimated Value
Home Financials for this Owner
Home Financials are based on the most recent Mortgage that was taken out on this home.
Original Mortgage
$476,000
Interest Rate
6.29%
Mortgage Type
Fannie Mae Freddie Mac
Purchase Details
Closed on
Sep 27, 2005
Sold by
Dang Cong Phon
Bought by
Cam Dang Cong Phon and Cam Van Dang
Purchase Details
Closed on
Dec 16, 2003
Sold by
Vandang Cam
Bought by
Dang Cong Phon
Create a Home Valuation Report for This Property
The Home Valuation Report is an in-depth analysis detailing your home's value as well as a comparison with similar homes in the area
Home Values in the Area
Average Home Value in this Area
Purchase History
| Date | Buyer | Sale Price | Title Company |
|---|---|---|---|
| Cam Dang Cong Phon | -- | Commonwealth Land Title | |
| Cam Dang Cong Phon | -- | None Available | |
| Dang Cong Phon | -- | Placer Title Company |
Source: Public Records
Mortgage History
| Date | Status | Borrower | Loan Amount |
|---|---|---|---|
| Closed | Cam Dang Cong Phon | $476,000 |
Source: Public Records
Tax History
| Year | Tax Paid | Tax Assessment Tax Assessment Total Assessment is a certain percentage of the fair market value that is determined by local assessors to be the total taxable value of land and additions on the property. | Land | Improvement |
|---|---|---|---|---|
| 2025 | $8,855 | $459,211 | $137,905 | $321,306 |
| 2024 | $8,855 | $450,209 | $135,202 | $315,007 |
| 2023 | $9,135 | $441,382 | $132,551 | $308,831 |
| 2022 | $8,709 | $432,728 | $129,952 | $302,776 |
| 2021 | $8,066 | $424,246 | $127,405 | $296,841 |
| 2020 | $7,969 | $419,900 | $126,100 | $293,800 |
| 2019 | $7,499 | $411,666 | $123,627 | $288,039 |
| 2018 | $7,341 | $403,594 | $121,203 | $282,391 |
| 2017 | $6,984 | $395,680 | $118,826 | $276,854 |
| 2016 | $6,732 | $387,923 | $116,497 | $271,426 |
| 2015 | $6,691 | $382,095 | $114,747 | $267,348 |
| 2014 | $6,361 | $340,000 | $102,000 | $238,000 |
Source: Public Records
Map
Nearby Homes
- 1140 E 22nd St
- 2301 12th Ave
- 925 E 19th St
- 836 E 19th St
- 725 E 21st St
- 1737 13th Ave
- 2445 10th Ave
- 2526 12th Ave
- 842 E 17th St
- 1641 E 20th St
- 2212 17th Ave
- 1736 E 21st St
- 1739 E 22nd St
- 2737 12th Ave
- 1533 14th Ave
- 1504 13th Ave
- 1515 14th Ave Unit 302
- 1515 14th Ave Unit 305
- 1444 9th Ave
- 1364 E 27th St
Your Personal Tour Guide
Ask me questions while you tour the home.