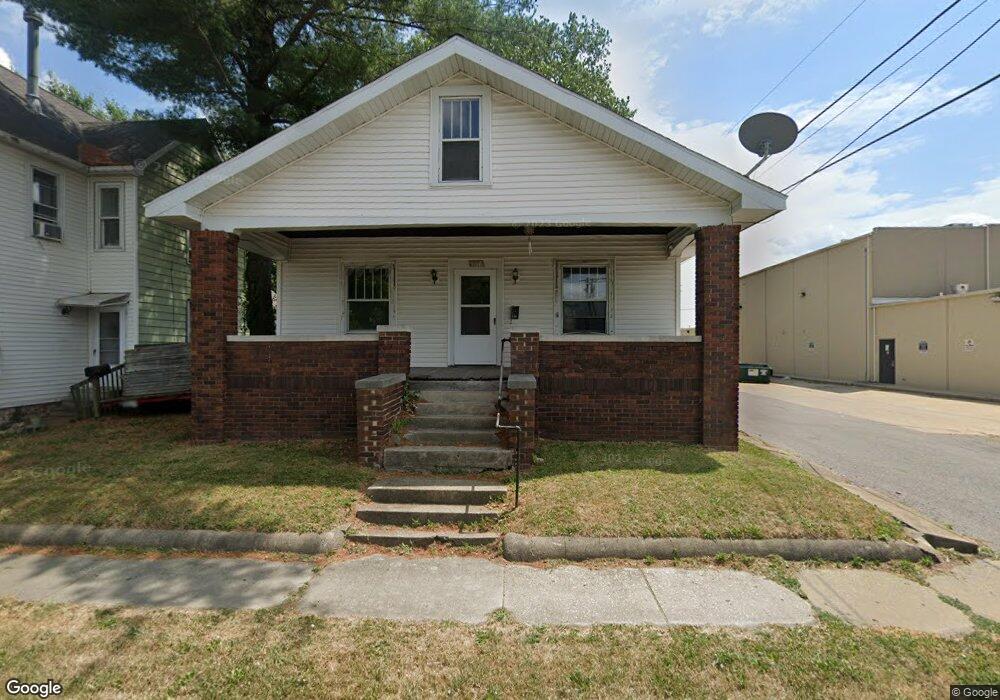
1116 E Cook St Springfield, IL 62703
Springfield Far East District NeighborhoodEstimated Value: $47,000 - $60,000
2
Beds
1
Bath
934
Sq Ft
$59/Sq Ft
Est. Value
About This Home
This home is located at 1116 E Cook St, Springfield, IL 62703 and is currently estimated at $55,154, approximately $59 per square foot. 1116 E Cook St is a home located in Sangamon County with nearby schools including Elizabeth Graham Elementary School, U.S. Grant Middle School, and Springfield High School.
Ownership History
Date
Name
Owned For
Owner Type
Purchase Details
Closed on
Jun 15, 2021
Sold by
R & L Holdings 1 Inc
Bought by
Acm Property Group Llc
Current Estimated Value
Home Financials for this Owner
Home Financials are based on the most recent Mortgage that was taken out on this home.
Original Mortgage
$55,840
Outstanding Balance
$46,519
Interest Rate
2.9%
Mortgage Type
New Conventional
Estimated Equity
$8,635
Purchase Details
Closed on
Jun 11, 2021
Sold by
R & L Holdings 1 Inc
Bought by
Acm Property Group Llc
Home Financials for this Owner
Home Financials are based on the most recent Mortgage that was taken out on this home.
Original Mortgage
$55,840
Outstanding Balance
$46,519
Interest Rate
2.9%
Mortgage Type
New Conventional
Estimated Equity
$8,635
Purchase Details
Closed on
Jan 2, 2018
Sold by
Jones Ravier D
Bought by
R & L Holdings 1
Purchase Details
Closed on
Jan 26, 2016
Purchase Details
Closed on
Oct 28, 2014
Create a Home Valuation Report for This Property
The Home Valuation Report is an in-depth analysis detailing your home's value as well as a comparison with similar homes in the area
Home Values in the Area
Average Home Value in this Area
Purchase History
| Date | Buyer | Sale Price | Title Company |
|---|---|---|---|
| Acm Property Group Llc | $70,000 | Prairie Land Title | |
| Acm Property Group Llc | $70,000 | Prairie Land Title | |
| R & L Holdings 1 | -- | -- | |
| -- | -- | -- | |
| -- | $9,500 | -- |
Source: Public Records
Mortgage History
| Date | Status | Borrower | Loan Amount |
|---|---|---|---|
| Open | Acm Property Group Llc | $55,840 | |
| Closed | Acm Property Group Llc | $55,840 |
Source: Public Records
Tax History
| Year | Tax Paid | Tax Assessment Tax Assessment Total Assessment is a certain percentage of the fair market value that is determined by local assessors to be the total taxable value of land and additions on the property. | Land | Improvement |
|---|---|---|---|---|
| 2024 | $1,639 | $19,511 | $1,111 | $18,400 |
| 2023 | $1,576 | $17,822 | $1,015 | $16,807 |
| 2022 | $1,515 | $16,906 | $963 | $15,943 |
| 2021 | $655 | $7,279 | $927 | $6,352 |
| 2020 | $642 | $7,290 | $928 | $6,362 |
| 2019 | $630 | $7,265 | $925 | $6,340 |
| 2018 | $681 | $8,056 | $920 | $7,136 |
| 2017 | $667 | $7,952 | $908 | $7,044 |
| 2016 | $654 | $7,836 | $895 | $6,941 |
| 2015 | $647 | $7,742 | $884 | $6,858 |
| 2014 | $637 | $7,692 | $878 | $6,814 |
| 2013 | $623 | $7,692 | $878 | $6,814 |
Source: Public Records
Map
Nearby Homes
- 1405 E Edwards St
- 1529 E Edwards St
- 718 S 7th St Unit 1003
- 718 S 7th St Unit 405
- 8 S Old State Capitol Plaza Unit A
- 1415 E Jefferson St
- 1025 S 5th St
- 910 S 2nd St
- 725 E Spruce St
- 1909 E Cedar St
- 2128 E Capitol Ave
- 1123 E Miller St
- 2238 E Stuart St
- 1942 S 11th St
- 821 S Pasfield St
- 1711 S 5th St
- 1838 S 19th St
- 2236 E Adams St
- 821 N 9th St
- 447 W Cook St
Your Personal Tour Guide
Ask me questions while you tour the home.