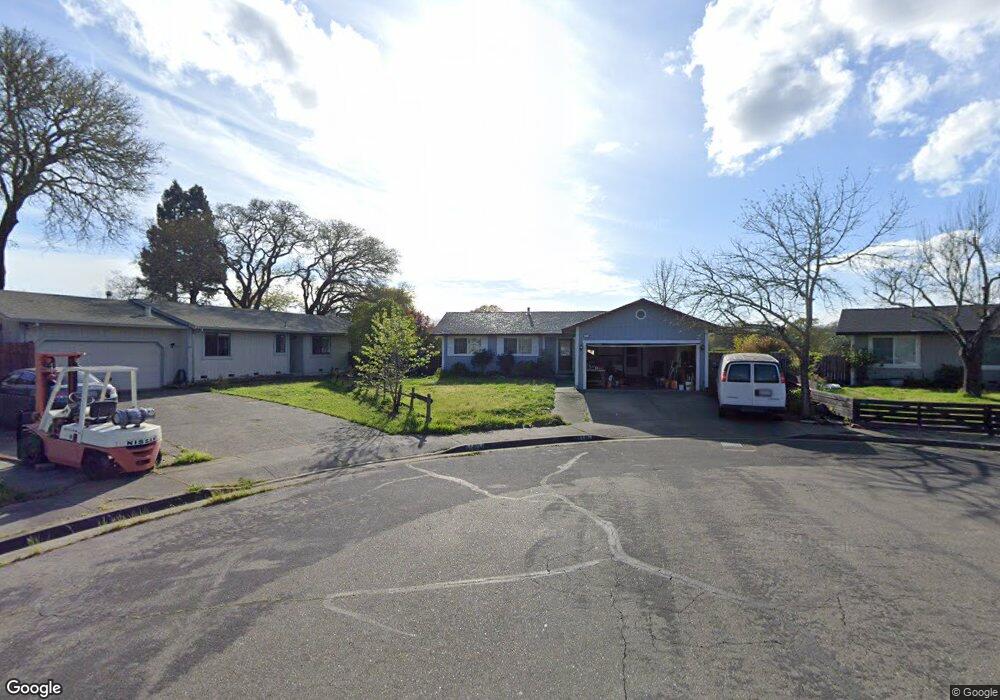
1116 Graham Ct Windsor, CA 95492
Estimated Value: $573,000 - $660,000
3
Beds
2
Baths
1,080
Sq Ft
$566/Sq Ft
Est. Value
About This Home
This home is located at 1116 Graham Ct, Windsor, CA 95492 and is currently estimated at $611,185, approximately $565 per square foot. 1116 Graham Ct is a home located in Sonoma County with nearby schools including Brooks Elementary School, Mattie Washburn Elementary School, and Windsor Middle School.
Ownership History
Date
Name
Owned For
Owner Type
Purchase Details
Closed on
Dec 30, 2015
Sold by
Edens Jeff S and Edens Lynn M
Bought by
The Edens Family Trust
Current Estimated Value
Home Financials for this Owner
Home Financials are based on the most recent Mortgage that was taken out on this home.
Original Mortgage
$175,000
Outstanding Balance
$74,245
Interest Rate
3.92%
Mortgage Type
New Conventional
Estimated Equity
$536,940
Purchase Details
Closed on
Aug 17, 2015
Sold by
Edens Jeffrey S and Edens Lynn M
Bought by
Edens Jeffrey S and Edens Lynn M
Purchase Details
Closed on
Nov 12, 1993
Sold by
Ramos Robert D and Ramos Blanca
Bought by
Edens Jeffrey S and Edens Lynn M
Home Financials for this Owner
Home Financials are based on the most recent Mortgage that was taken out on this home.
Original Mortgage
$142,405
Interest Rate
6.88%
Create a Home Valuation Report for This Property
The Home Valuation Report is an in-depth analysis detailing your home's value as well as a comparison with similar homes in the area
Home Values in the Area
Average Home Value in this Area
Purchase History
| Date | Buyer | Sale Price | Title Company |
|---|---|---|---|
| The Edens Family Trust | -- | Fidelity National Title Co | |
| Edens Jeff S | -- | Fidelity National Title Co | |
| Edens Jeffrey S | -- | None Available | |
| Edens Jeffrey S | -- | None Available | |
| Edens Jeffrey S | $150,000 | North Bay Title Co |
Source: Public Records
Mortgage History
| Date | Status | Borrower | Loan Amount |
|---|---|---|---|
| Open | Edens Jeff S | $175,000 | |
| Closed | Edens Jeffrey S | $142,405 |
Source: Public Records
Tax History
| Year | Tax Paid | Tax Assessment Tax Assessment Total Assessment is a certain percentage of the fair market value that is determined by local assessors to be the total taxable value of land and additions on the property. | Land | Improvement |
|---|---|---|---|---|
| 2025 | $3,217 | $255,137 | $127,651 | $127,486 |
| 2024 | $3,217 | $250,136 | $125,149 | $124,987 |
| 2023 | $3,217 | $245,233 | $122,696 | $122,537 |
| 2022 | $3,107 | $240,426 | $120,291 | $120,135 |
| 2021 | $3,060 | $235,713 | $117,933 | $117,780 |
| 2020 | $3,124 | $233,297 | $116,724 | $116,573 |
| 2019 | $3,120 | $228,724 | $114,436 | $114,288 |
| 2018 | $3,078 | $224,241 | $112,193 | $112,048 |
| 2017 | $3,051 | $219,845 | $109,994 | $109,851 |
| 2016 | $2,805 | $215,536 | $107,838 | $107,698 |
| 2015 | $2,732 | $212,300 | $106,219 | $106,081 |
| 2014 | $2,691 | $208,143 | $104,139 | $104,004 |
Source: Public Records
Map
Nearby Homes
- 985 Gumview Rd
- 9821 Dawn Way
- 10845 Rio Ruso Dr
- 105 Zapata Ct
- 411 Walten Way
- 772 Mcclelland Dr Unit U11
- 107 Bouquet Cir
- 129 Wooded Glen Ct
- 100 Wooded Glen Ct
- 536 Sauvignon Place
- 207 Othello Ct
- 8596 Starr Rd
- 9551 Old Redwood Hwy
- 8185 Old Redwood Hwy
- 9830 Marcella Ln
- 202 Johnson St Unit U14
- 191 Johnson St
- 185 Johnson St
- 280 Decanter Cir
- 125 Johnson St
- 1112 Graham Ct
- 1117 Graham Ct
- 1113 Graham Ct
- 9560 Wellington Cir
- 1109 Graham Ct
- 9552 Wellington Cir
- 1104 Graham Ct
- 9564 Wellington Cir
- 1105 Graham Ct
- 9596 Orion Dr
- 9548 Wellington Cir
- 9568 Wellington Cir
- 9600 Orion Dr
- 9581 Erika Dr
- 9588 Orion Dr
- 9544 Wellington Cir
- 9547 Wellington Cir
- 9551 Wellington Cir
- 1008 Graham Ct
Your Personal Tour Guide
Ask me questions while you tour the home.