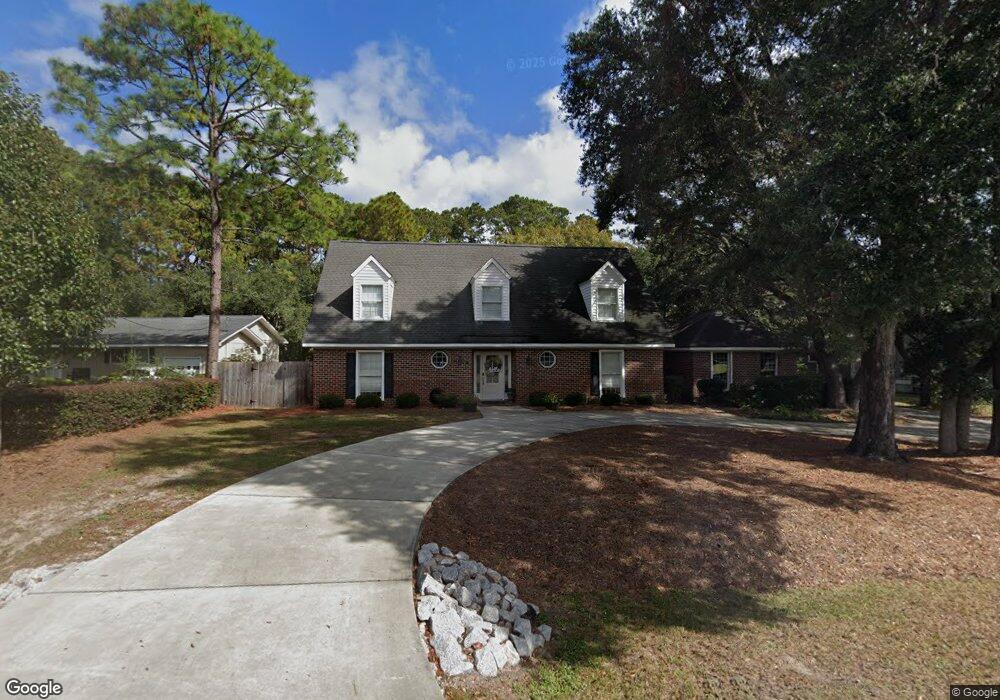
1116 Hawthorn Dr Pawleys Island, SC 29585
Estimated Value: $595,565 - $702,000
4
Beds
4
Baths
2,717
Sq Ft
$238/Sq Ft
Est. Value
About This Home
This home is located at 1116 Hawthorn Dr, Pawleys Island, SC 29585 and is currently estimated at $647,641, approximately $238 per square foot. 1116 Hawthorn Dr is a home located in Georgetown County with nearby schools including Waccamaw Elementary School, Waccamaw Intermediate School, and Waccamaw Middle School.
Ownership History
Date
Name
Owned For
Owner Type
Purchase Details
Closed on
Oct 27, 2017
Sold by
Harris Matthew Adam and Harris Jenny Mcfaddin
Bought by
Lyles Michael D and Lyles Krystal C
Current Estimated Value
Home Financials for this Owner
Home Financials are based on the most recent Mortgage that was taken out on this home.
Original Mortgage
$342,000
Outstanding Balance
$286,048
Interest Rate
3.78%
Mortgage Type
New Conventional
Estimated Equity
$361,593
Purchase Details
Closed on
Dec 3, 2015
Sold by
Bradshaw James B
Bought by
Harris Matthew Adams and Harris Jenny Mcfaddin
Home Financials for this Owner
Home Financials are based on the most recent Mortgage that was taken out on this home.
Original Mortgage
$258,825
Interest Rate
3.97%
Mortgage Type
VA
Purchase Details
Closed on
May 1, 2008
Sold by
Hall Wilber S and Hall Rosa S
Bought by
Hall Wilber S and Hall Rosa S
Create a Home Valuation Report for This Property
The Home Valuation Report is an in-depth analysis detailing your home's value as well as a comparison with similar homes in the area
Home Values in the Area
Average Home Value in this Area
Purchase History
| Date | Buyer | Sale Price | Title Company |
|---|---|---|---|
| Lyles Michael D | $360,000 | None Available | |
| Harris Matthew Adams | $280,000 | -- | |
| Hall Wilber S | -- | -- |
Source: Public Records
Mortgage History
| Date | Status | Borrower | Loan Amount |
|---|---|---|---|
| Open | Lyles Michael D | $342,000 | |
| Previous Owner | Harris Matthew Adams | $258,825 |
Source: Public Records
Tax History Compared to Growth
Tax History
| Year | Tax Paid | Tax Assessment Tax Assessment Total Assessment is a certain percentage of the fair market value that is determined by local assessors to be the total taxable value of land and additions on the property. | Land | Improvement |
|---|---|---|---|---|
| 2024 | $1,843 | $13,990 | $2,800 | $11,190 |
| 2023 | $1,843 | $13,990 | $2,800 | $11,190 |
| 2022 | $1,697 | $13,990 | $2,800 | $11,190 |
| 2021 | $1,644 | $13,992 | $2,800 | $11,192 |
| 2020 | $1,543 | $13,120 | $2,800 | $10,320 |
| 2019 | $1,655 | $14,276 | $2,880 | $11,396 |
| 2018 | $4,934 | $142,760 | $0 | $0 |
| 2017 | $1,256 | $121,400 | $0 | $0 |
| 2016 | $1,241 | $18,210 | $0 | $0 |
| 2015 | $1,046 | $0 | $0 | $0 |
| 2014 | $1,046 | $297,600 | $72,000 | $225,600 |
| 2012 | -- | $297,600 | $72,000 | $225,600 |
Source: Public Records
Map
Nearby Homes
- 118 Goodson Loop Unit Lot 5 Litchfield Cou
- 1120 Crooked Oak Dr
- 311 Parkview Dr
- 1495 Hawthorn Dr
- 1464 Hawthorn Dr Unit LCC 16
- 1217 Hawthorn Dr Unit Lot 52 Litchfield Co
- 607 Hawthorn Dr
- 1131 Tradition Club Dr
- 1692 Tradition Club Dr
- 149 Old Cedar Loop
- 695 Country Club Dr Unit POND / GOLF FRONTAGE
- 346 Tuckers Rd Unit A
- 23 Revolution Ct Unit Access to Litchfield
- 62 Makepeace Rd Unit New Construction -
- 856 All Saints Loop
- 383 Oatland Lake Rd
- 118 Oatland Lake Rd
- 59 Bay Tree Place
- 168 MacKinley Cir
- 88 Carrington Dr
- 1116 Hawthorn Dr Unit Litchfield Country C
- 851 Hawthorn Dr
- 1092 Hawthorn Dr
- 1138 Hawthorn Dr
- 1097 Hawthorn Dr
- 1125 Hawthorn Dr
- 1154 Hawthorn Dr
- 1062 Hawthorn Dr
- 1145 Hawthorn Dr
- LOT 11 Spicebush Ln
- 1176 Hawthorn Dr
- 1040 Hawthorn Dr
- 31 Spicebush Ln
- 36 Spicebush Ln
- 1039 Hawthorn Dr
- 1173 Hawthorn Dr
- 1194 Hawthorn Dr
- 1026 Hawthorn Dr
- TBD Spicebush Ln Unit 220 feet of golf cou
- 41 Spicebush Ln