Estimated Value: $160,000 - $187,000
--
Bed
1
Bath
--
Sq Ft
0.31
Acres
About This Home
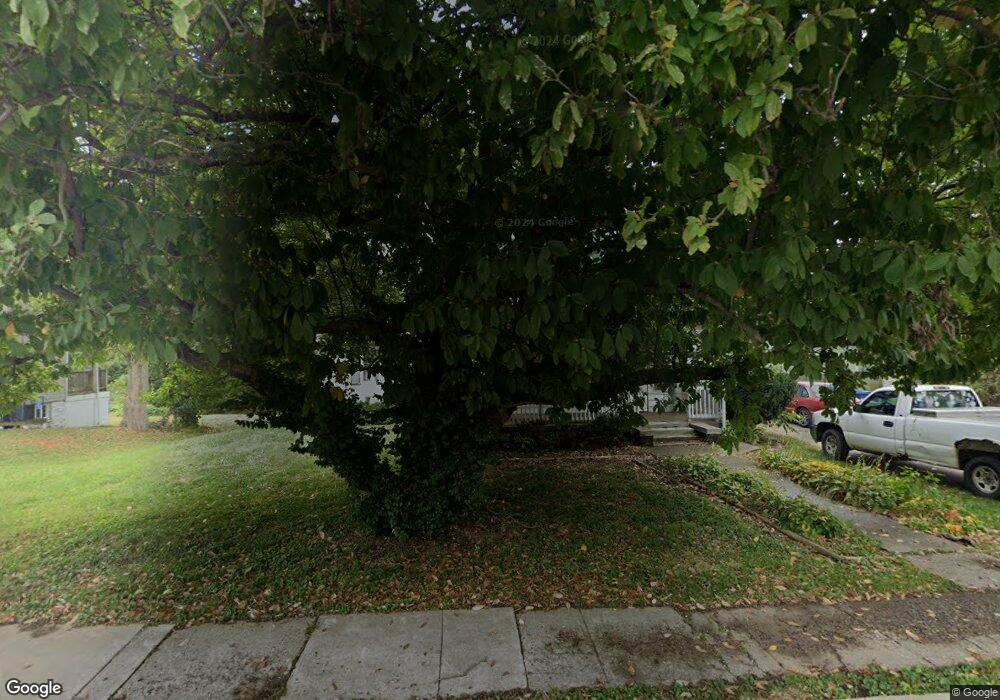
This home is located at 1116 Main St, Alton, IL 62002 and is currently estimated at $171,667. 1116 Main St is a home located in Madison County with nearby schools including East Elementary School, Alton Middle School, and Alton High School.
Ownership History
Date
Name
Owned For
Owner Type
Purchase Details
Closed on
Dec 29, 2022
Sold by
Rusty Door Properties Llc
Bought by
Owl Commercial Llc
Current Estimated Value
Home Financials for this Owner
Home Financials are based on the most recent Mortgage that was taken out on this home.
Original Mortgage
$722,000
Outstanding Balance
$684,982
Interest Rate
3.67%
Mortgage Type
Commercial
Estimated Equity
-$513,315
Purchase Details
Closed on
Dec 27, 2016
Sold by
Cnb Bank And Trust Na
Bought by
Rusty Door Properties Llc
Purchase Details
Closed on
Oct 26, 2016
Sold by
Flack Donald M
Bought by
Cnb Bank & Trust Na
Purchase Details
Closed on
Jan 8, 2004
Sold by
Stewart Genevieve and Hosford Russell
Bought by
Rhino Solutions Group Llc
Home Financials for this Owner
Home Financials are based on the most recent Mortgage that was taken out on this home.
Original Mortgage
$89,000
Interest Rate
5.94%
Mortgage Type
Purchase Money Mortgage
Create a Home Valuation Report for This Property
The Home Valuation Report is an in-depth analysis detailing your home's value as well as a comparison with similar homes in the area
Home Values in the Area
Average Home Value in this Area
Purchase History
| Date | Buyer | Sale Price | Title Company |
|---|---|---|---|
| Owl Commercial Llc | $722,000 | Serenity Title & Escrow | |
| Rusty Door Properties Llc | -- | Serenity Title & Escrow | |
| Cnb Bank & Trust Na | -- | -- | |
| Rhino Solutions Group Llc | $86,000 | Prairie State Title & Escrow |
Source: Public Records
Mortgage History
| Date | Status | Borrower | Loan Amount |
|---|---|---|---|
| Open | Owl Commercial Llc | $722,000 | |
| Previous Owner | Rhino Solutions Group Llc | $89,000 |
Source: Public Records
Tax History Compared to Growth
Tax History
| Year | Tax Paid | Tax Assessment Tax Assessment Total Assessment is a certain percentage of the fair market value that is determined by local assessors to be the total taxable value of land and additions on the property. | Land | Improvement |
|---|---|---|---|---|
| 2024 | $3,516 | $43,250 | $4,990 | $38,260 |
| 2023 | $3,516 | $39,060 | $4,510 | $34,550 |
| 2022 | $3,304 | $35,310 | $4,080 | $31,230 |
| 2021 | $3,040 | $33,180 | $3,830 | $29,350 |
| 2020 | $2,969 | $31,990 | $3,690 | $28,300 |
| 2019 | $3,071 | $31,270 | $3,610 | $27,660 |
| 2018 | $2,989 | $30,460 | $3,520 | $26,940 |
| 2017 | $2,947 | $30,460 | $3,520 | $26,940 |
| 2016 | $2,888 | $30,460 | $3,520 | $26,940 |
| 2015 | $2,744 | $30,460 | $3,520 | $26,940 |
| 2014 | $2,744 | $30,460 | $3,520 | $26,940 |
| 2013 | $2,744 | $31,290 | $3,620 | $27,670 |
Source: Public Records
Map
Nearby Homes
- 1220 Main St
- 1155 Washington Ave
- 1116 Washington Ave
- 1215 Clawson St
- 2701 Watalee St
- 2638 Sanford Ave
- 2441 Sanford Ave
- 2901 Fernwood Ave
- 2801 Brown St
- 609 Marsh Ave
- 1521 Seminary St
- 2116 Mills Ave
- 1516 Spaulding St
- 515 Lampert St
- 3013 Mayfield Ave
- 3006 Watalee St
- 2510 Denny Ave
- 2006 Agnes St
- 2209 College Ave
- 2000 Agnes St