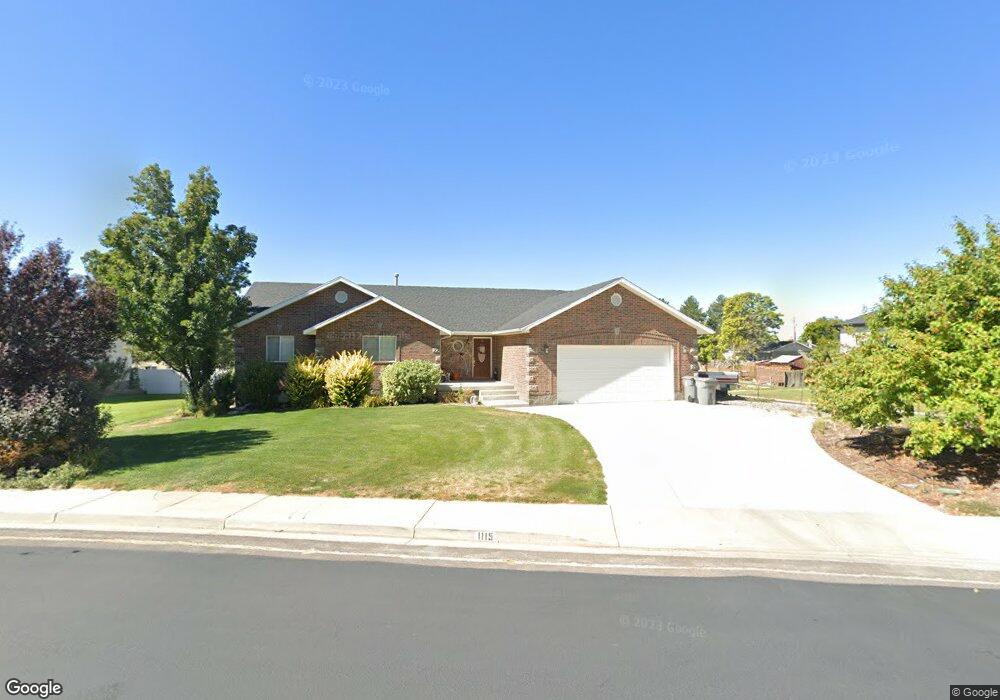
1116 N 700 E Mapleton, UT 84664
Estimated Value: $683,000 - $777,000
3
Beds
4
Baths
1,764
Sq Ft
$409/Sq Ft
Est. Value
About This Home
This home is located at 1116 N 700 E, Mapleton, UT 84664 and is currently estimated at $721,430, approximately $408 per square foot. 1116 N 700 E is a home located in Utah County with nearby schools including Hobble Creek School, Mapleton Junior High School, and Maple Mountain High School.
Ownership History
Date
Name
Owned For
Owner Type
Purchase Details
Closed on
Aug 31, 2018
Sold by
Abbott Shannon
Bought by
Hall Kent W and Hall Jeanette F
Current Estimated Value
Home Financials for this Owner
Home Financials are based on the most recent Mortgage that was taken out on this home.
Original Mortgage
$286,000
Outstanding Balance
$248,895
Interest Rate
4.5%
Mortgage Type
New Conventional
Estimated Equity
$472,535
Purchase Details
Closed on
Apr 13, 2015
Sold by
Abbott Shannon
Bought by
Abbott Shannon
Home Financials for this Owner
Home Financials are based on the most recent Mortgage that was taken out on this home.
Original Mortgage
$250,000
Interest Rate
3.7%
Mortgage Type
New Conventional
Purchase Details
Closed on
Feb 15, 2013
Sold by
Robinson Douglas Max and Robinson Carol Ann
Bought by
Abbott Shannon
Home Financials for this Owner
Home Financials are based on the most recent Mortgage that was taken out on this home.
Original Mortgage
$243,016
Interest Rate
3.75%
Mortgage Type
FHA
Purchase Details
Closed on
Jan 7, 2008
Sold by
Robinson Douglas Max and Robinson Carol Ann
Bought by
Robinson Douglas Max and Robinson Carol Ann
Purchase Details
Closed on
Nov 13, 2002
Sold by
Hatfield Richard and Hatfield Julie A
Bought by
Robinson Douglas Max and Robinson Carol Ann
Home Financials for this Owner
Home Financials are based on the most recent Mortgage that was taken out on this home.
Original Mortgage
$198,500
Interest Rate
5.95%
Purchase Details
Closed on
Oct 30, 2001
Sold by
Hatfield Richard and Hatfield Doyle
Bought by
Hatfield Richard and Hatfield Julie A
Home Financials for this Owner
Home Financials are based on the most recent Mortgage that was taken out on this home.
Original Mortgage
$200,000
Interest Rate
6.84%
Purchase Details
Closed on
Jun 6, 2000
Sold by
Christiansen Brook N and Christiansen Amy L
Bought by
Hatfield Richard and Hatfield Doyle
Home Financials for this Owner
Home Financials are based on the most recent Mortgage that was taken out on this home.
Original Mortgage
$150,000
Interest Rate
8.15%
Mortgage Type
Construction
Create a Home Valuation Report for This Property
The Home Valuation Report is an in-depth analysis detailing your home's value as well as a comparison with similar homes in the area
Home Values in the Area
Average Home Value in this Area
Purchase History
| Date | Buyer | Sale Price | Title Company |
|---|---|---|---|
| Hall Kent W | -- | First American Title Ins Co | |
| Abbott Shannon | -- | North American Title | |
| Abbott Shannon | -- | Inwest Title Services Inc | |
| Robinson Douglas Max | -- | None Available | |
| Robinson Douglas Max | -- | Mountain West Title Co | |
| Robinson Douglas Max | -- | Mountain West Title Co | |
| Hatfield Richard | -- | Inwest Title Services Inc | |
| Hatfield Richard | -- | Inwest Title Services Inc |
Source: Public Records
Mortgage History
| Date | Status | Borrower | Loan Amount |
|---|---|---|---|
| Open | Hall Kent W | $286,000 | |
| Previous Owner | Abbott Shannon | $250,000 | |
| Previous Owner | Abbott Shannon | $243,016 | |
| Previous Owner | Robinson Douglas Max | $198,500 | |
| Previous Owner | Hatfield Richard | $200,000 | |
| Previous Owner | Hatfield Richard | $150,000 |
Source: Public Records
Tax History
| Year | Tax Paid | Tax Assessment Tax Assessment Total Assessment is a certain percentage of the fair market value that is determined by local assessors to be the total taxable value of land and additions on the property. | Land | Improvement |
|---|---|---|---|---|
| 2025 | $3,503 | $385,385 | -- | -- |
| 2024 | $3,503 | $343,200 | $0 | $0 |
| 2023 | $3,634 | $358,270 | $0 | $0 |
| 2022 | $3,586 | $349,580 | $0 | $0 |
| 2021 | $3,007 | $450,000 | $168,700 | $281,300 |
| 2020 | $2,975 | $430,600 | $149,300 | $281,300 |
| 2019 | $2,625 | $387,800 | $143,200 | $244,600 |
| 2018 | $2,306 | $324,400 | $120,600 | $203,800 |
| 2017 | $2,335 | $174,295 | $0 | $0 |
| 2016 | $2,292 | $170,115 | $0 | $0 |
| 2015 | $2,222 | $163,900 | $0 | $0 |
| 2014 | $2,033 | $147,235 | $0 | $0 |
Source: Public Records
Map
Nearby Homes
- 594 E 1000 N
- 435 E 1000 N
- 1096 N 1000 E
- 1567 N 600 E Unit 26
- 775 N 800 E
- 1350 N Main St
- 265 E 600 N
- 1447 N 1350 St E Unit 5
- 1577 N 1350 St E Unit 1
- 1477 N 1350 St E Unit 4
- 1547 N 1350 St E Unit 2
- 1511 N 1350 St E Unit 3
- 1548 N 1350 St E Unit 11
- 1578 N 1350 St E Unit 12
- 897 N Main St
- 84 E 530 N
- 310 N 800 E
- 145 W Carnesecca Ct
- 141 N 600 E
- 1564 N 1700 East St
Your Personal Tour Guide
Ask me questions while you tour the home.