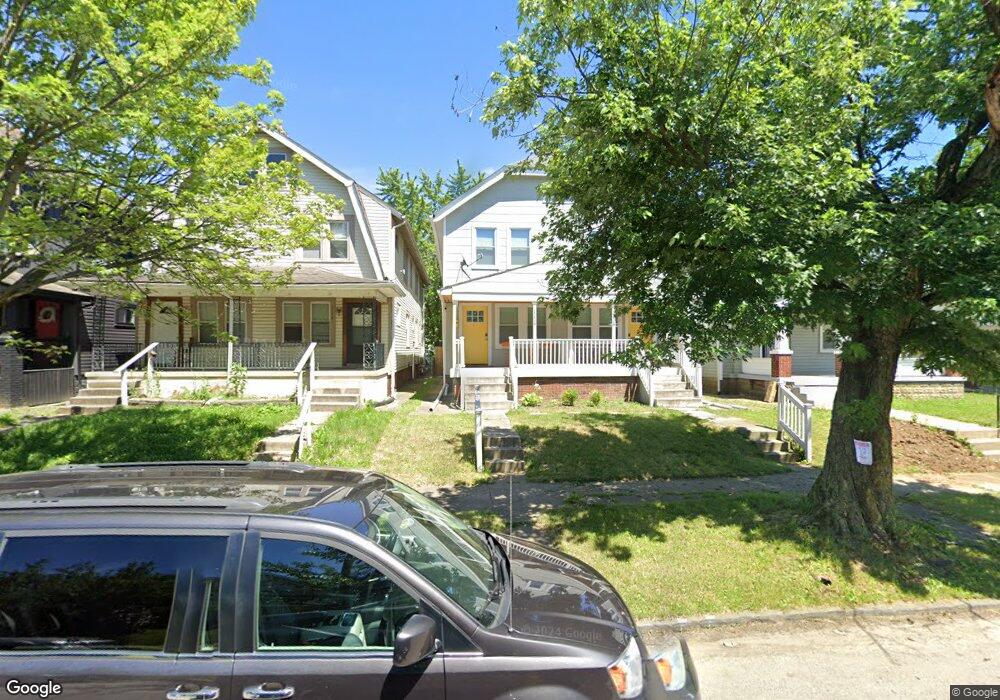
1116 S Ohio Ave Unit 118 Columbus, OH 43206
Karns Park NeighborhoodEstimated Value: $348,000 - $440,000
6
Beds
2
Baths
2,464
Sq Ft
$154/Sq Ft
Est. Value
About This Home
This home is located at 1116 S Ohio Ave Unit 118, Columbus, OH 43206 and is currently estimated at $380,180, approximately $154 per square foot. 1116 S Ohio Ave Unit 118 is a home located in Franklin County with nearby schools including Livingston Elementary School, South High School, and Capital Collegiate Preparatory Academy.
Ownership History
Date
Name
Owned For
Owner Type
Purchase Details
Closed on
Aug 25, 2022
Sold by
Somchay Moukdarath
Bought by
Scott-Wheeler Annastasia Lakeisha
Current Estimated Value
Home Financials for this Owner
Home Financials are based on the most recent Mortgage that was taken out on this home.
Original Mortgage
$300,000
Outstanding Balance
$286,007
Interest Rate
4.99%
Mortgage Type
New Conventional
Estimated Equity
$94,173
Purchase Details
Closed on
Jan 3, 2020
Sold by
Slhf Limited Co
Bought by
Moukdarath Somchay and Keomany Somsavanh
Home Financials for this Owner
Home Financials are based on the most recent Mortgage that was taken out on this home.
Original Mortgage
$105,400
Interest Rate
3.6%
Mortgage Type
New Conventional
Purchase Details
Closed on
Oct 5, 2009
Sold by
Harden Tonya V and Williams Thomas R
Bought by
Slhf Limited
Purchase Details
Closed on
Dec 5, 1994
Sold by
Harden Tonya V
Bought by
Real Estate Investments
Purchase Details
Closed on
Nov 17, 1992
Purchase Details
Closed on
Jul 15, 1991
Create a Home Valuation Report for This Property
The Home Valuation Report is an in-depth analysis detailing your home's value as well as a comparison with similar homes in the area
Home Values in the Area
Average Home Value in this Area
Purchase History
| Date | Buyer | Sale Price | Title Company |
|---|---|---|---|
| Scott-Wheeler Annastasia Lakeisha | $375,000 | Chicago Title | |
| Moukdarath Somchay | $124,000 | Stewart Title | |
| Slhf Limited | $5,600 | Talon Group | |
| Real Estate Investments | $42,000 | -- | |
| -- | $23,000 | -- | |
| -- | -- | -- |
Source: Public Records
Mortgage History
| Date | Status | Borrower | Loan Amount |
|---|---|---|---|
| Open | Scott-Wheeler Annastasia Lakeisha | $300,000 | |
| Previous Owner | Moukdarath Somchay | $105,400 |
Source: Public Records
Tax History Compared to Growth
Tax History
| Year | Tax Paid | Tax Assessment Tax Assessment Total Assessment is a certain percentage of the fair market value that is determined by local assessors to be the total taxable value of land and additions on the property. | Land | Improvement |
|---|---|---|---|---|
| 2024 | $5,001 | $110,260 | $22,510 | $87,750 |
| 2023 | $5,151 | $110,250 | $22,505 | $87,745 |
| 2022 | $956 | $18,210 | $5,430 | $12,780 |
| 2021 | $1,201 | $18,210 | $5,430 | $12,780 |
| 2020 | $1,235 | $18,210 | $5,430 | $12,780 |
| 2019 | $871 | $14,010 | $4,170 | $9,840 |
| 2018 | $760 | $14,010 | $4,170 | $9,840 |
| 2017 | $792 | $14,010 | $4,170 | $9,840 |
| 2016 | $713 | $10,500 | $3,570 | $6,930 |
| 2015 | $649 | $10,500 | $3,570 | $6,930 |
| 2014 | $651 | $10,500 | $3,570 | $6,930 |
| 2013 | $482 | $15,750 | $3,570 | $12,180 |
Source: Public Records
Map
Nearby Homes
- 1146 S Champion Ave Unit 1148
- 883 E Whittier St
- 1196 S Ohio Ave
- 1170 S Champion Ave
- 1191 S 22nd St Unit 1185
- 000 Gilbert St
- 00 Gilbert St
- 1225-1227 S Champion Ave
- 1062 E Deshler Ave
- 1064 Heyl Ave
- 981 Gilbert St
- 853 Thurman Ave
- 1284-1286 S Champion Ave
- 1154-1156 Wilson Ave
- 993 Oakwood Ave
- 1100 Wilson Ave Unit 1100
- 975 Carpenter St
- 1045 Wilson Ave Unit 47
- 1286-1288 Oakwood Ave Unit 1286
- 935 S Ohio Ave
- 1116 S Ohio Ave Unit 18
- 1116 S Ohio Ave Unit 1118
- 1120 S Ohio Ave
- 1112-1114 S Ohio Ave
- 1112-1114 S Ohio Ave Unit 114
- 1112 S Ohio Ave Unit 114
- 1112 S Ohio Ave Unit 14
- 1126 S Ohio Ave
- 1128 S Ohio Ave
- 1108 S Ohio Ave Unit 110
- 1104 S Ohio Ave
- 1115 S Ohio Ave
- 928 Siebert St
- 1098 S Ohio Ave Unit 100
- 1098 S Ohio Ave Unit 2
- 1138 1140 S Ohio Ave
- 1138 S Ohio Ave Unit 140
- 1123 S Ohio Ave Unit 125
- 1123-1125 S Ohio Ave Unit 1123