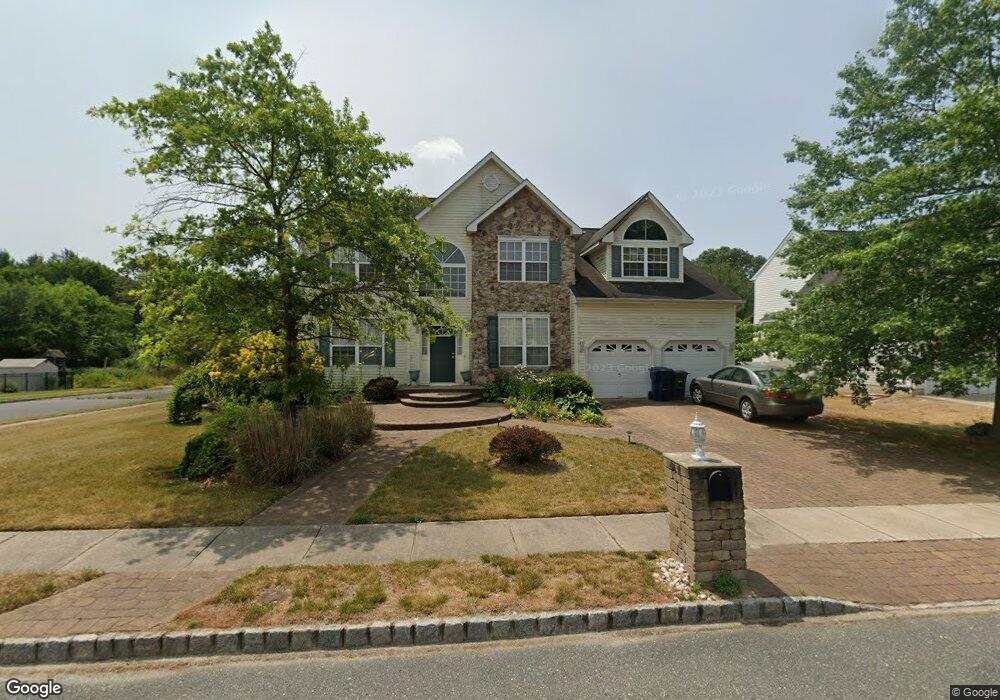
1116 Tamarind Place Williamstown, NJ 08094
Monroe Township Gloucester NeighborhoodEstimated Value: $582,012 - $600,000
4
Beds
3
Baths
2,966
Sq Ft
$199/Sq Ft
Est. Value
About This Home
This home is located at 1116 Tamarind Place, Williamstown, NJ 08094 and is currently estimated at $588,753, approximately $198 per square foot. 1116 Tamarind Place is a home located in Gloucester County with nearby schools including Williamstown High School, St. Mary School, and Finest of the Wheat Christian.
Ownership History
Date
Name
Owned For
Owner Type
Purchase Details
Closed on
Nov 1, 2010
Sold by
Messinezis Nikolaos and Messinezis Maria
Bought by
Charran Samuel L
Current Estimated Value
Purchase Details
Closed on
Apr 27, 2005
Sold by
Morrissey James M and Morrissey Jeanne L
Bought by
Messinezis Nikolaos and Messinezis Maria
Home Financials for this Owner
Home Financials are based on the most recent Mortgage that was taken out on this home.
Original Mortgage
$327,510
Interest Rate
8.33%
Mortgage Type
Fannie Mae Freddie Mac
Purchase Details
Closed on
Sep 21, 2001
Sold by
Piersol Homes Corp
Bought by
Morrissey James M
Home Financials for this Owner
Home Financials are based on the most recent Mortgage that was taken out on this home.
Original Mortgage
$188,000
Interest Rate
6.91%
Purchase Details
Closed on
May 4, 2001
Sold by
Triad Iii Llc
Bought by
Piersol Homes Corp
Create a Home Valuation Report for This Property
The Home Valuation Report is an in-depth analysis detailing your home's value as well as a comparison with similar homes in the area
Home Values in the Area
Average Home Value in this Area
Purchase History
| Date | Buyer | Sale Price | Title Company |
|---|---|---|---|
| Charran Samuel L | $250,000 | Excellence In Title Agency | |
| Messinezis Nikolaos | $363,900 | -- | |
| Morrissey James M | $235,400 | -- | |
| Piersol Homes Corp | $15,250 | Fidelity National Title Ins |
Source: Public Records
Mortgage History
| Date | Status | Borrower | Loan Amount |
|---|---|---|---|
| Previous Owner | Messinezis Nikolaos | $327,510 | |
| Previous Owner | Morrissey James M | $188,000 |
Source: Public Records
Tax History Compared to Growth
Tax History
| Year | Tax Paid | Tax Assessment Tax Assessment Total Assessment is a certain percentage of the fair market value that is determined by local assessors to be the total taxable value of land and additions on the property. | Land | Improvement |
|---|---|---|---|---|
| 2025 | $11,539 | $315,100 | $54,000 | $261,100 |
| 2024 | $11,454 | $315,100 | $54,000 | $261,100 |
| 2023 | $11,454 | $315,100 | $54,000 | $261,100 |
| 2022 | $11,400 | $315,100 | $54,000 | $261,100 |
| 2021 | $11,222 | $315,100 | $54,000 | $261,100 |
| 2020 | $11,460 | $315,100 | $54,000 | $261,100 |
| 2019 | $11,391 | $315,100 | $54,000 | $261,100 |
| 2018 | $11,205 | $315,100 | $54,000 | $261,100 |
| 2017 | $10,463 | $295,400 | $72,300 | $223,100 |
| 2016 | $10,080 | $295,400 | $72,300 | $223,100 |
| 2015 | $9,785 | $295,400 | $72,300 | $223,100 |
| 2014 | $10,472 | $325,100 | $72,300 | $252,800 |
Source: Public Records
Map
Nearby Homes
- 1121 Lafayette St
- 2406 Exposition Dr Unit 2406
- 505 Matisse Way Unit 505
- 206 Raphael Ct
- 1406 Exposition Dr
- 1735 Black Oak Rd
- 1638 Red Oak Rd
- 1605 Pin Oak Rd
- 1602 Pin Oak Rd
- 1601 White Oak Ln
- 395 Staggerbush Rd
- 1137 S Beecham Rd
- 112 Hemlock Dr
- 943 Sykesville Rd
- 248 Karen Dr
- 1017 Micawber Dr
- 415 Stockton Loop
- 1008 London Cir
- 304 Thackeray Ln
- 1011 S Beecham Rd
- 1112 Tamarind Place
- 1120 Tamarind Place
- 1108 Tamarind Place
- 1115 Tamarind Place
- 1107 Tamarind Place
- 1121 Tamarind Place
- 1124 Tamarind Place
- 1104 Tamarind Place
- 1325 Mulberry Ln
- 1324 Mulberry Ln
- 1324 Sassafras Ln
- 1127 Tamarind Place
- 1321 Mulberry Ln
- 1100 Tamarind Place
- 1320 Mulberry Ln
- 1320 Sassafras Ln
- 1329 Sassafras Ln
- 1137 Tamarind Place
- 0000 Bluebell Rd
- 1317 Mulberry Ln