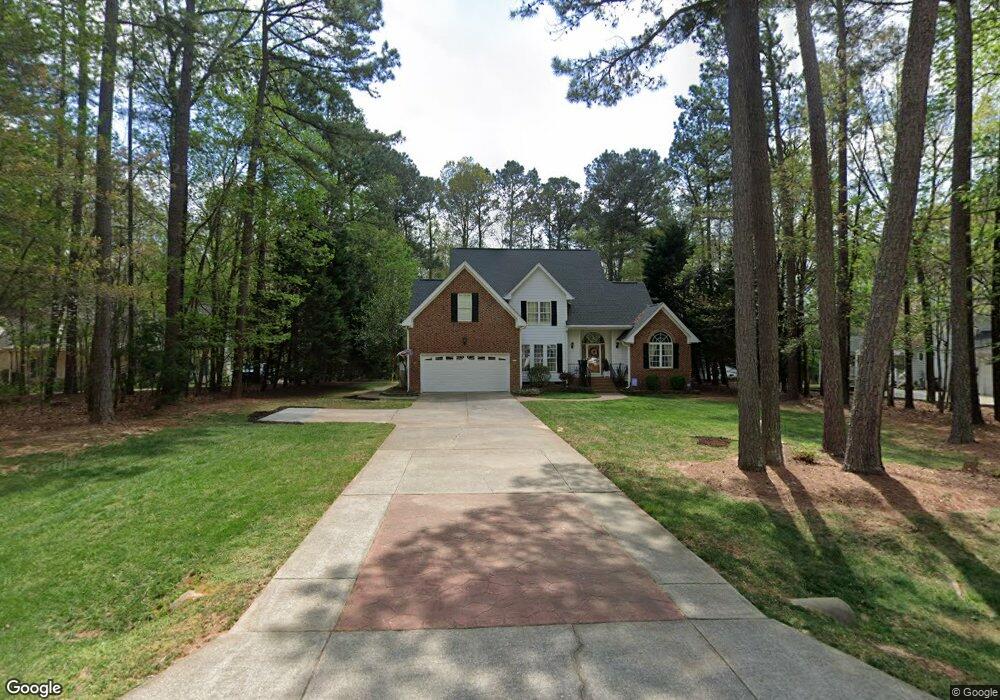
1116 Urania Dr Raleigh, NC 27603
Estimated Value: $469,000 - $513,000
3
Beds
3
Baths
2,293
Sq Ft
$212/Sq Ft
Est. Value
About This Home
This home is located at 1116 Urania Dr, Raleigh, NC 27603 and is currently estimated at $487,205, approximately $212 per square foot. 1116 Urania Dr is a home located in Wake County with nearby schools including North Garner Middle and Garner High.
Ownership History
Date
Name
Owned For
Owner Type
Purchase Details
Closed on
Apr 17, 2018
Sold by
Rodgers Timothy and Latitia Rodgers J
Bought by
Russo Frank F and Russo Judith E
Current Estimated Value
Purchase Details
Closed on
Apr 12, 1999
Sold by
Oak Ridge Realty & Construction Inc
Bought by
Rodgers Timothy and Rodgers Latitia
Home Financials for this Owner
Home Financials are based on the most recent Mortgage that was taken out on this home.
Original Mortgage
$128,536
Interest Rate
7.08%
Purchase Details
Closed on
Apr 14, 1998
Sold by
Steve Dickson Builder Inc
Bought by
Oak Ridge Realty & Construction Inc
Home Financials for this Owner
Home Financials are based on the most recent Mortgage that was taken out on this home.
Original Mortgage
$115,000
Interest Rate
7.14%
Create a Home Valuation Report for This Property
The Home Valuation Report is an in-depth analysis detailing your home's value as well as a comparison with similar homes in the area
Home Values in the Area
Average Home Value in this Area
Purchase History
| Date | Buyer | Sale Price | Title Company |
|---|---|---|---|
| Russo Frank F | $268,500 | None Available | |
| Rodgers Timothy | $160,500 | -- | |
| Oak Ridge Realty & Construction Inc | $23,500 | -- |
Source: Public Records
Mortgage History
| Date | Status | Borrower | Loan Amount |
|---|---|---|---|
| Previous Owner | Rodgers Timothy | $128,536 | |
| Previous Owner | Oak Ridge Realty & Construction Inc | $115,000 |
Source: Public Records
Tax History Compared to Growth
Tax History
| Year | Tax Paid | Tax Assessment Tax Assessment Total Assessment is a certain percentage of the fair market value that is determined by local assessors to be the total taxable value of land and additions on the property. | Land | Improvement |
|---|---|---|---|---|
| 2025 | -- | $454,341 | $90,000 | $364,341 |
| 2024 | $2,841 | $454,341 | $90,000 | $364,341 |
| 2023 | $2,089 | $265,376 | $40,000 | $225,376 |
| 2022 | $1,937 | $265,376 | $40,000 | $225,376 |
| 2021 | $1,885 | $265,376 | $40,000 | $225,376 |
| 2020 | $1,854 | $265,376 | $40,000 | $225,376 |
| 2019 | $1,899 | $230,054 | $40,000 | $190,054 |
| 2018 | $0 | $230,054 | $40,000 | $190,054 |
| 2017 | $1,656 | $230,054 | $40,000 | $190,054 |
| 2016 | $1,622 | $230,054 | $40,000 | $190,054 |
| 2015 | $1,737 | $247,222 | $48,000 | $199,222 |
| 2014 | -- | $247,222 | $48,000 | $199,222 |
Source: Public Records
Map
Nearby Homes
- 392 Travel Lite Dr
- 272 Travel Lite Dr
- 6908 Longridge Dr
- 120 Line Dr
- 1153 Polo Dr
- 408 Johnston Rd
- 6408 Glen Brack Ct
- 170 Sallyport Ct
- 4212 Rockside Hills Dr
- 6313 Southern Charm Ln
- 221 Old Hickory Dr
- 6257 Oak Passage Dr
- 595 Durwood Dr
- 618 Durwood Dr
- 6121 Catandpolly Ln
- 7508 Frasier Fir Place
- 6009 Swales Way
- 6600 Rock Service Station Rd
- 212 Fox Pen Dr
- 1021 Wintu Ct
- 1108 Urania Dr
- 1120 Urania Dr
- LOT 3 Urania Dr
- 1104 Urania Dr
- 1113 Urania Dr
- 1117 Urania Dr
- 1128 Urania Dr
- 6825 Pinnacle Ridge Rd
- 1125 Urania Dr
- 1105 Urania Dr
- 1129 Urania Dr
- 6901 Pinnacle Ridge Rd
- 6801 Pinnacle Ridge Rd
- 6909 Pinnacle Ridge Rd
- 6905 Pinnacle Ridge Rd
- 6824 Pinnacle Ridge Rd
- 6820 Pinnacle Ridge Rd
- 0 Pinnacle Ridge Rd Unit 1742619
- 0 Pinnacle Ridge Rd Unit 1 TR1742619
- 0 Pinnacle Ridge Rd Unit 1