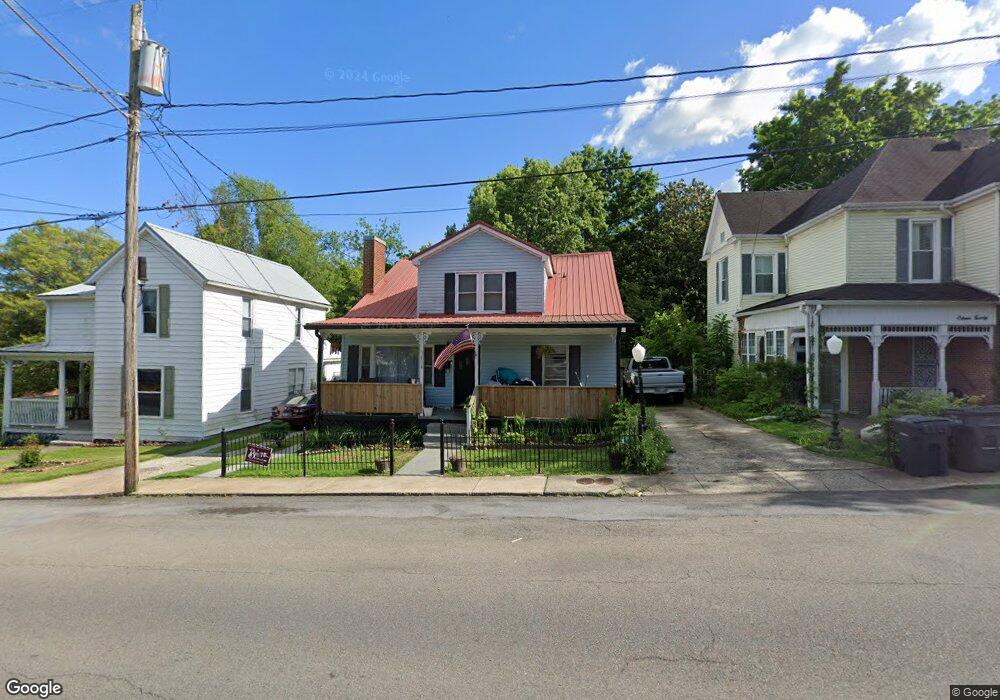
1116 Windsor Ave Bristol, TN 37620
Estimated Value: $175,000 - $215,000
Studio
2
Baths
2,400
Sq Ft
$81/Sq Ft
Est. Value
About This Home
This home is located at 1116 Windsor Ave, Bristol, TN 37620 and is currently estimated at $195,225, approximately $81 per square foot. 1116 Windsor Ave is a home located in Sullivan County with nearby schools including Anderson Elementary School, Vance Middle School, and Tennessee High School.
Ownership History
Date
Name
Owned For
Owner Type
Purchase Details
Closed on
Dec 12, 2025
Sold by
Hubbard Michael and Hubbard Laurie
Bought by
Roller Gail
Current Estimated Value
Purchase Details
Closed on
Nov 21, 2022
Sold by
Adventure From Home Inc
Bought by
Norton Zachary Paul
Home Financials for this Owner
Home Financials are based on the most recent Mortgage that was taken out on this home.
Original Mortgage
$121,774
Interest Rate
6.94%
Mortgage Type
FHA
Purchase Details
Closed on
Mar 12, 2022
Sold by
Mullins Anthony K
Bought by
Adventure From Home Inc
Purchase Details
Closed on
Oct 15, 2018
Sold by
Edens J Wesley
Bought by
Mullins Anthony K
Purchase Details
Closed on
Nov 19, 1997
Sold by
Peoples Ina V L and Peoples E
Bought by
Jones Jack H
Home Financials for this Owner
Home Financials are based on the most recent Mortgage that was taken out on this home.
Original Mortgage
$54,900
Interest Rate
7.38%
Create a Home Valuation Report for This Property
The Home Valuation Report is an in-depth analysis detailing your home's value as well as a comparison with similar homes in the area
Purchase History
| Date | Buyer | Sale Price | Title Company |
|---|---|---|---|
| Roller Gail | $43,000 | Heritage Title | |
| Norton Zachary Paul | $136,000 | Foundation Title | |
| Adventure From Home Inc | $90,000 | Foundation Title | |
| Mullins Anthony K | -- | None Available | |
| Jones Jack H | $43,000 | -- |
Source: Public Records
Mortgage History
| Date | Status | Borrower | Loan Amount |
|---|---|---|---|
| Previous Owner | Norton Zachary Paul | $121,774 | |
| Previous Owner | Jones Jack H | $54,900 |
Source: Public Records
Tax History
| Year | Tax Paid | Tax Assessment Tax Assessment Total Assessment is a certain percentage of the fair market value that is determined by local assessors to be the total taxable value of land and additions on the property. | Land | Improvement |
|---|---|---|---|---|
| 2025 | -- | $62,900 | $3,225 | $59,675 |
| 2024 | -- | $32,900 | $1,700 | $31,200 |
| 2023 | $1,445 | $32,900 | $1,700 | $31,200 |
| 2022 | $1,445 | $32,900 | $1,700 | $31,200 |
| 2021 | $1,445 | $32,900 | $1,700 | $31,200 |
| 2020 | $1,476 | $32,900 | $1,700 | $31,200 |
| 2019 | $1,476 | $31,200 | $1,700 | $29,500 |
| 2018 | $1,470 | $31,200 | $1,700 | $29,500 |
| 2017 | $1,470 | $31,200 | $1,700 | $29,500 |
| 2016 | $1,130 | $23,400 | $1,700 | $21,700 |
| 2014 | $1,065 | $23,376 | $0 | $0 |
Source: Public Records
Map
Nearby Homes
- 1120 Windsor Ave
- 1114 Windsor Ave
- 1126 Windsor Ave
- 1130 Windsor Ave
- 1117 Hill St
- 1115 Hill St
- 1119 Hill St
- 1119 Windsor Ave Unit 3
- 1119 Windsor Ave
- 1119 Windsor Ave Unit 1
- 1119 Windsor Ave Unit 2
- 1119 Windsor Ave
- 1125 Windsor Ave
- 1109 Hill St
- 1131 Hill St
- 1100 Windsor Ave
- 1131 Windsor Ave Unit 4
- 1131 Windsor Ave
- 1113 Windsor Ave
- 1107 Hill St
Your Personal Tour Guide
Ask me questions while you tour the home.