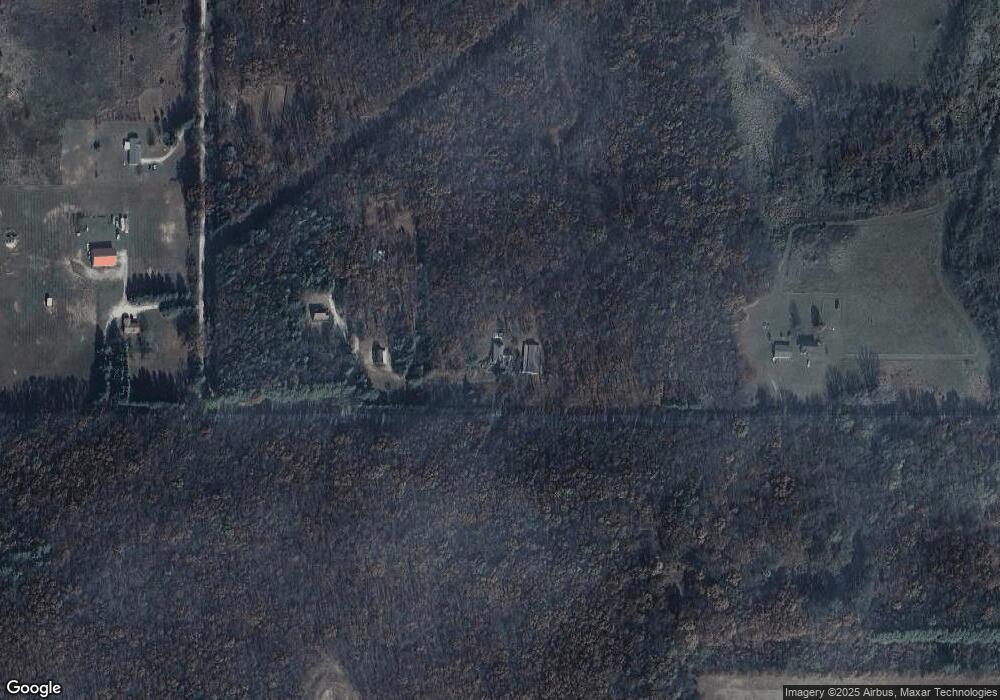
11160 E 150 N Grovertown, IN 46531
Estimated Value: $370,000 - $393,000
4
Beds
3
Baths
2,544
Sq Ft
$149/Sq Ft
Est. Value
About This Home
This home is located at 11160 E 150 N, Grovertown, IN 46531 and is currently estimated at $380,049, approximately $149 per square foot. 11160 E 150 N is a home located in Starke County with nearby schools including Knox Community Elementary School, Knox Community Middle School, and Knox Community High School.
Ownership History
Date
Name
Owned For
Owner Type
Purchase Details
Closed on
Apr 13, 2020
Sold by
Gardner Del R
Bought by
Shelley Beaumont
Current Estimated Value
Home Financials for this Owner
Home Financials are based on the most recent Mortgage that was taken out on this home.
Interest Rate
3.33%
Purchase Details
Closed on
Apr 11, 2020
Sold by
Gardner Del R and Gardner Angela S
Bought by
Beaumont Shelley
Home Financials for this Owner
Home Financials are based on the most recent Mortgage that was taken out on this home.
Interest Rate
3.33%
Create a Home Valuation Report for This Property
The Home Valuation Report is an in-depth analysis detailing your home's value as well as a comparison with similar homes in the area
Purchase History
| Date | Buyer | Sale Price | Title Company |
|---|---|---|---|
| Shelley Beaumont | $90,000 | -- | |
| Beaumont Shelley | -- | Meridian Title Corp |
Source: Public Records
Mortgage History
| Date | Status | Borrower | Loan Amount |
|---|---|---|---|
| Closed | Shelley Beaumont | -- |
Source: Public Records
Tax History Compared to Growth
Tax History
| Year | Tax Paid | Tax Assessment Tax Assessment Total Assessment is a certain percentage of the fair market value that is determined by local assessors to be the total taxable value of land and additions on the property. | Land | Improvement |
|---|---|---|---|---|
| 2024 | $1,637 | $230,800 | $24,200 | $206,600 |
| 2023 | $1,571 | $209,200 | $21,600 | $187,600 |
| 2022 | $1,156 | $146,200 | $20,000 | $126,200 |
| 2021 | $945 | $118,200 | $19,600 | $98,600 |
| 2020 | $2,591 | $127,000 | $19,500 | $107,500 |
| 2019 | $2,428 | $120,100 | $20,100 | $100,000 |
| 2018 | $2,314 | $114,700 | $18,500 | $96,200 |
| 2017 | $2,229 | $110,400 | $19,000 | $91,400 |
| 2016 | $2,177 | $107,700 | $19,200 | $88,500 |
| 2014 | $2,072 | $111,200 | $19,300 | $91,900 |
| 2013 | $2,024 | $110,100 | $18,800 | $91,300 |
Source: Public Records
Map
Nearby Homes