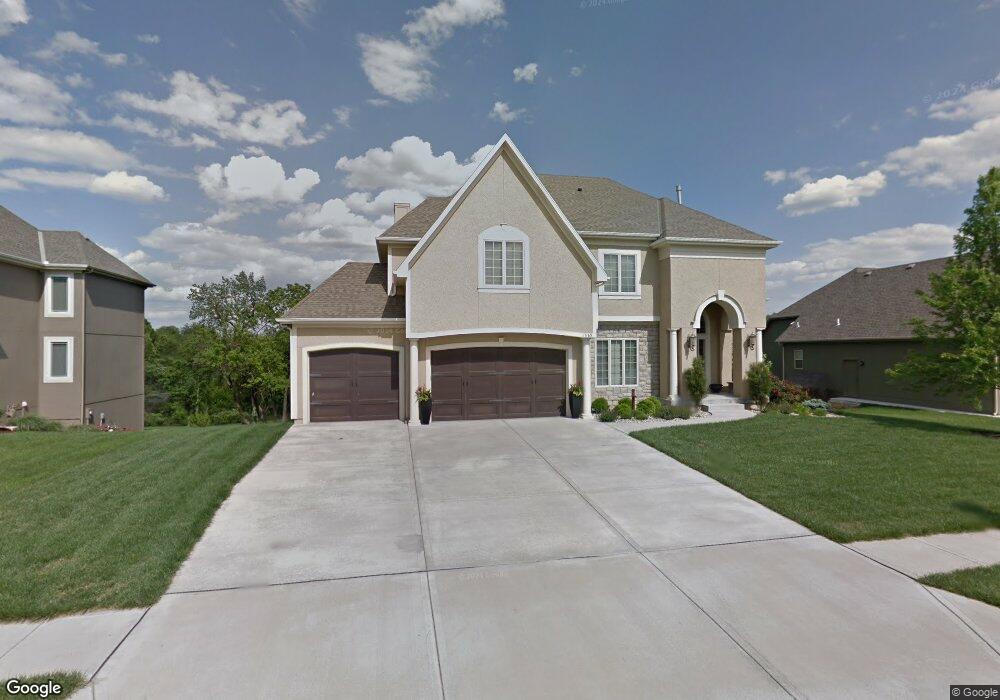
11165 S Crestone St Olathe, KS 66061
Estimated Value: $671,715 - $797,000
4
Beds
4
Baths
3,571
Sq Ft
$203/Sq Ft
Est. Value
About This Home
This home is located at 11165 S Crestone St, Olathe, KS 66061 and is currently estimated at $726,429, approximately $203 per square foot. 11165 S Crestone St is a home located in Johnson County with nearby schools including Meadow Lane Elementary School, Prairie Trail Middle School, and Olathe Northwest High School.
Ownership History
Date
Name
Owned For
Owner Type
Purchase Details
Closed on
Aug 24, 2012
Sold by
Schlittenhard Barbara K
Bought by
Schlittenhard Chad A and Schlittenhard Barbara K
Current Estimated Value
Home Financials for this Owner
Home Financials are based on the most recent Mortgage that was taken out on this home.
Original Mortgage
$304,000
Outstanding Balance
$177,016
Interest Rate
3.49%
Mortgage Type
New Conventional
Estimated Equity
$549,413
Purchase Details
Closed on
Oct 9, 2008
Sold by
Schlittenhard Chad and Schlittenhard Barb
Bought by
Schlittenhard Chad A and Schlittenhard Barbara K
Purchase Details
Closed on
Jun 28, 2007
Sold by
Plk Development Inc
Bought by
Schlittenhard Chad and Schlittenhard Barb
Home Financials for this Owner
Home Financials are based on the most recent Mortgage that was taken out on this home.
Original Mortgage
$300,000
Interest Rate
6.37%
Mortgage Type
Future Advance Clause Open End Mortgage
Create a Home Valuation Report for This Property
The Home Valuation Report is an in-depth analysis detailing your home's value as well as a comparison with similar homes in the area
Home Values in the Area
Average Home Value in this Area
Purchase History
| Date | Buyer | Sale Price | Title Company |
|---|---|---|---|
| Schlittenhard Chad A | -- | None Available | |
| Schlittenhard Chad A | -- | None Available | |
| Schlittenhard Chad | -- | First American Title Insuran |
Source: Public Records
Mortgage History
| Date | Status | Borrower | Loan Amount |
|---|---|---|---|
| Open | Schlittenhard Chad A | $304,000 | |
| Closed | Schlittenhard Chad | $300,000 |
Source: Public Records
Tax History Compared to Growth
Tax History
| Year | Tax Paid | Tax Assessment Tax Assessment Total Assessment is a certain percentage of the fair market value that is determined by local assessors to be the total taxable value of land and additions on the property. | Land | Improvement |
|---|---|---|---|---|
| 2024 | $8,473 | $74,244 | $11,382 | $62,862 |
| 2023 | $8,634 | $74,612 | $11,382 | $63,230 |
| 2022 | $7,731 | $65,021 | $11,382 | $53,639 |
| 2021 | $7,731 | $59,340 | $11,382 | $47,958 |
| 2020 | $7,408 | $59,087 | $11,382 | $47,705 |
| 2019 | $7,326 | $58,040 | $9,561 | $48,479 |
| 2018 | $7,571 | $59,535 | $9,561 | $49,974 |
| 2017 | $7,255 | $56,465 | $8,688 | $47,777 |
| 2016 | $7,828 | $54,142 | $7,549 | $46,593 |
| 2015 | $7,076 | $50,014 | $6,508 | $43,506 |
| 2013 | -- | $47,277 | $8,240 | $39,037 |
Source: Public Records
Map
Nearby Homes
- 11239 S Crestone St
- Westwood Plan at Cedar Ridge Reserve - Cedar Ridge
- Truman Plan at Cedar Ridge Reserve - Cedar Ridge
- Roosevelt Ex Plan at Cedar Ridge Reserve - Cedar Ridge
- Roosevelt SE Plan at Cedar Ridge Reserve - Cedar Ridge
- Roosevelt Plan at Cedar Ridge Reserve - Cedar Ridge
- Roosevelt Ranch SE Plan at Cedar Ridge Reserve - Cedar Ridge
- Riviera Plan at Cedar Ridge Reserve - Cedar Ridge
- Oakmont Plan at Cedar Ridge Reserve - Cedar Ridge
- Madison II Plan at Cedar Ridge Reserve - Cedar Ridge
- Kingston Plan at Cedar Ridge Reserve - Cedar Ridge
- Jefferson IV Plan at Cedar Ridge Reserve - Cedar Ridge
- Jefferson III Plan at Cedar Ridge Reserve - Cedar Ridge
- Jefferson II Plan at Cedar Ridge Reserve - Cedar Ridge
- Jefferson Ex Plan at Cedar Ridge Reserve - Cedar Ridge
- Jefferson 4 Car Plan at Cedar Ridge Reserve - Cedar Ridge
- Jefferson 1.5 EX Plan at Cedar Ridge Reserve - Cedar Ridge
- Jackson II Plan at Cedar Ridge Reserve - Cedar Ridge
- Harbor Plan at Cedar Ridge Reserve - Cedar Ridge
- Hamilton SE Plan at Cedar Ridge Reserve - Cedar Ridge
- 11151 S Crestone St
- 11179 S Crestone St
- 11172 S Crestone St
- 11158 S Crestone St
- 11137 S Crestone St
- 11186 S Crestone St
- 11136 S Crestone St
- 11193 S Crestone St
- 11208 S Race St
- 11123 S Crestone St
- 11203 S Race St
- 11207 S Crestone St
- 11214 S Race St Unit 11
- 11214 S Race St
- 11211 S Race St
- 11215 S Crestone St
- 20255 College Blvd
- 20410 W 111th Terrace
- 11220 S Race St
- 11221 S Race St