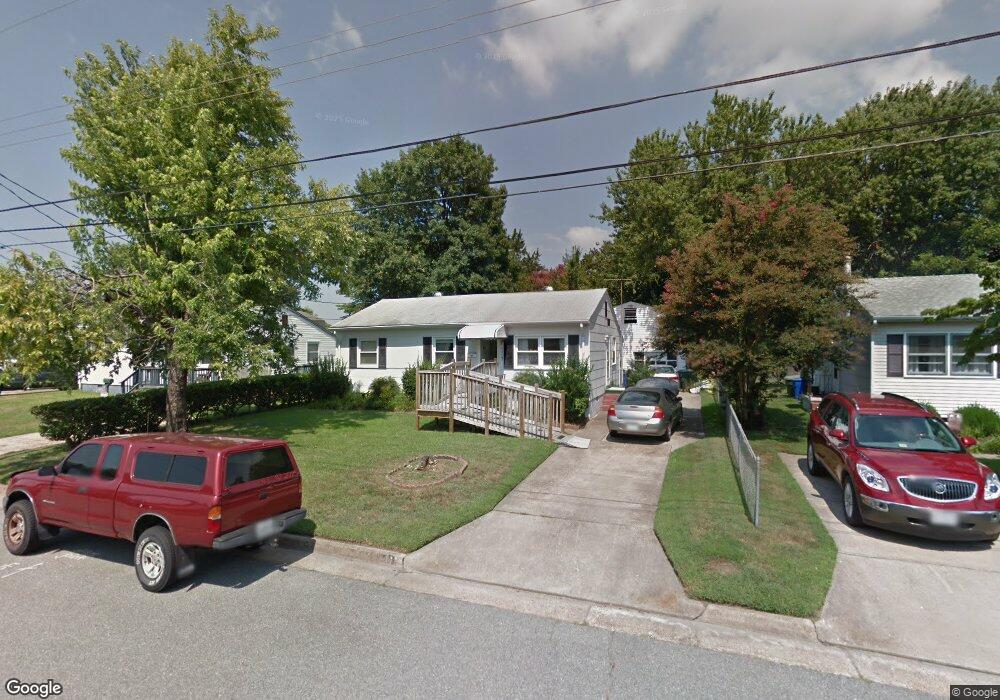
1117 73rd St Newport News, VA 23605
Chestnut NeighborhoodEstimated Value: $169,000 - $214,450
3
Beds
1
Bath
928
Sq Ft
$208/Sq Ft
Est. Value
About This Home
This home is located at 1117 73rd St, Newport News, VA 23605 and is currently estimated at $192,613, approximately $207 per square foot. 1117 73rd St is a home located in Newport News City with nearby schools including Carver Elementary School, Crittenden Middle School, and Heritage High School.
Ownership History
Date
Name
Owned For
Owner Type
Purchase Details
Closed on
Sep 21, 2022
Sold by
Riddle Jeffery F
Bought by
Allerdice Nakea
Current Estimated Value
Home Financials for this Owner
Home Financials are based on the most recent Mortgage that was taken out on this home.
Original Mortgage
$148,000
Outstanding Balance
$141,363
Interest Rate
5.22%
Mortgage Type
New Conventional
Estimated Equity
$51,250
Create a Home Valuation Report for This Property
The Home Valuation Report is an in-depth analysis detailing your home's value as well as a comparison with similar homes in the area
Home Values in the Area
Average Home Value in this Area
Purchase History
| Date | Buyer | Sale Price | Title Company |
|---|---|---|---|
| Allerdice Nakea | $158,000 | Commonwealth Land Title |
Source: Public Records
Mortgage History
| Date | Status | Borrower | Loan Amount |
|---|---|---|---|
| Open | Allerdice Nakea | $148,000 |
Source: Public Records
Tax History Compared to Growth
Tax History
| Year | Tax Paid | Tax Assessment Tax Assessment Total Assessment is a certain percentage of the fair market value that is determined by local assessors to be the total taxable value of land and additions on the property. | Land | Improvement |
|---|---|---|---|---|
| 2024 | $2,002 | $169,700 | $48,400 | $121,300 |
| 2023 | $1,991 | $156,300 | $44,000 | $112,300 |
| 2022 | $1,750 | $156,600 | $44,000 | $112,600 |
| 2021 | $1,750 | $131,400 | $40,000 | $91,400 |
| 2020 | $1,638 | $122,200 | $40,000 | $82,200 |
| 2019 | $1,542 | $114,700 | $40,000 | $74,700 |
| 2018 | $1,495 | $111,100 | $40,000 | $71,100 |
| 2017 | $1,495 | $111,100 | $40,000 | $71,100 |
| 2016 | $1,490 | $111,100 | $40,000 | $71,100 |
| 2015 | $1,484 | $111,100 | $40,000 | $71,100 |
| 2014 | $1,379 | $111,100 | $40,000 | $71,100 |
Source: Public Records
Map
Nearby Homes