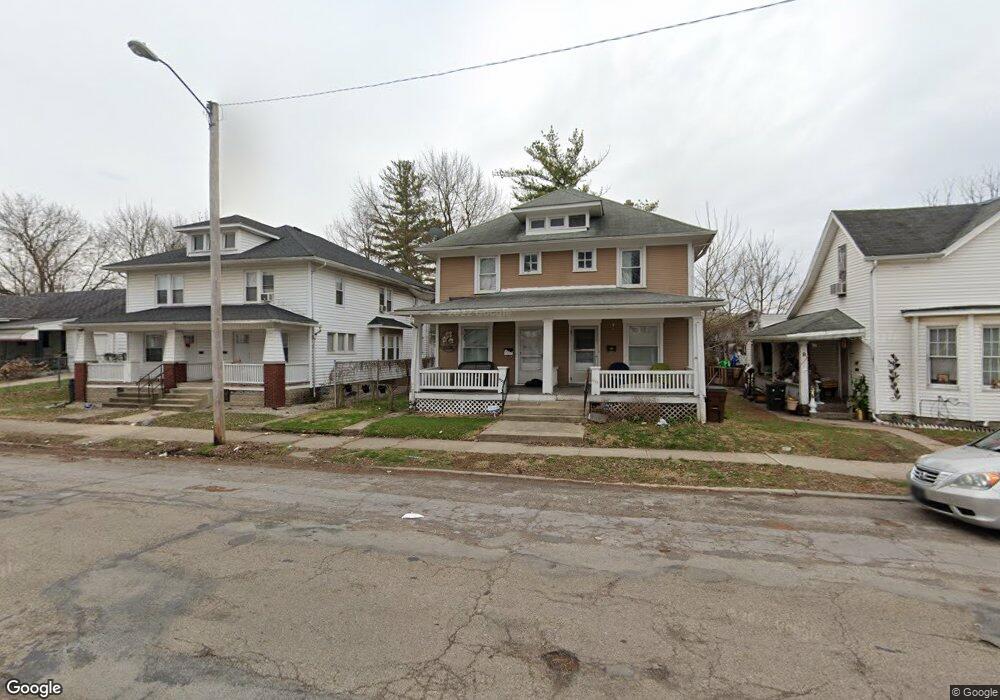
1117 Maiden Ln Unit 1119 Springfield, OH 45504
Estimated Value: $122,815 - $139,000
6
Beds
2
Baths
2,520
Sq Ft
$51/Sq Ft
Est. Value
About This Home
This home is located at 1117 Maiden Ln Unit 1119, Springfield, OH 45504 and is currently estimated at $128,704, approximately $51 per square foot. 1117 Maiden Ln Unit 1119 is a home located in Clark County with nearby schools including Snyder Park Elementary School, Roosevelt Middle School, and Springfield High School.
Ownership History
Date
Name
Owned For
Owner Type
Purchase Details
Closed on
Mar 28, 2006
Sold by
Pinkerton C William and Pinkerton Paulette M
Bought by
F A M I L Y Home Rentals Llc
Current Estimated Value
Purchase Details
Closed on
Dec 27, 2005
Sold by
Fenwick Robert A and Fenwick Lori M
Bought by
Pinkerton C William and Pinkerton Paulette M
Home Financials for this Owner
Home Financials are based on the most recent Mortgage that was taken out on this home.
Original Mortgage
$66,400
Interest Rate
7%
Mortgage Type
Fannie Mae Freddie Mac
Purchase Details
Closed on
Aug 19, 2000
Sold by
Barnhart Denise Ann
Bought by
Fenwick Robert and Fenwick Lori
Home Financials for this Owner
Home Financials are based on the most recent Mortgage that was taken out on this home.
Original Mortgage
$63,100
Interest Rate
9.12%
Mortgage Type
Adjustable Rate Mortgage/ARM
Create a Home Valuation Report for This Property
The Home Valuation Report is an in-depth analysis detailing your home's value as well as a comparison with similar homes in the area
Home Values in the Area
Average Home Value in this Area
Purchase History
| Date | Buyer | Sale Price | Title Company |
|---|---|---|---|
| F A M I L Y Home Rentals Llc | -- | None Available | |
| Pinkerton C William | $83,000 | -- | |
| Fenwick Robert | $61,000 | -- |
Source: Public Records
Mortgage History
| Date | Status | Borrower | Loan Amount |
|---|---|---|---|
| Previous Owner | Pinkerton C William | $66,400 | |
| Previous Owner | Fenwick Robert | $63,100 |
Source: Public Records
Tax History
| Year | Tax Paid | Tax Assessment Tax Assessment Total Assessment is a certain percentage of the fair market value that is determined by local assessors to be the total taxable value of land and additions on the property. | Land | Improvement |
|---|---|---|---|---|
| 2025 | $1,431 | $39,470 | $4,210 | $35,260 |
| 2024 | $2,002 | $25,260 | $3,220 | $22,040 |
| 2023 | $1,700 | $25,260 | $3,220 | $22,040 |
| 2022 | $2,636 | $25,260 | $3,220 | $22,040 |
| 2021 | $1,300 | $23,660 | $3,010 | $20,650 |
| 2020 | $1,303 | $23,660 | $3,010 | $20,650 |
| 2019 | $1,306 | $23,660 | $3,010 | $20,650 |
| 2018 | $1,313 | $22,820 | $3,540 | $19,280 |
| 2017 | $1,312 | $22,817 | $3,535 | $19,282 |
| 2016 | $1,314 | $22,817 | $3,535 | $19,282 |
| 2015 | $1,298 | $22,103 | $3,535 | $18,568 |
| 2014 | $1,292 | $22,103 | $3,535 | $18,568 |
| 2013 | $1,278 | $22,103 | $3,535 | $18,568 |
Source: Public Records
Map
Nearby Homes
- 306 N Western Ave
- 101`103 N Western
- 1205 Kinsman Ave
- 366 N Isabella St
- 423 N Jackson St Unit 425
- 239 N Shaffer St
- 311 N Shaffer St
- 430 N Jackson St
- 1420 Parker Ct
- 1205 W High St
- 424 N Shaffer St
- 424-424 1/2 N Shaffer St
- 1225 W High St
- 1417 W Main St
- 1500 W Main St
- 705 Grant St Unit 705
- 40 Zischler St
- 1504 W High St
- 727 W High St
- 222 N Race St Unit 224
- 1113 Maiden Ln Unit 1115
- 1121 Maiden Ln
- 1127 Maiden Ln Unit 1129
- 1109 Maiden Ln
- 1118 W North St Unit 1120
- 1114 W North St
- 1122 W North St Unit 1124
- 1108 W North St
- 1128 W North St
- 1101 Maiden Ln
- 1100 W North St
- 1116 Maiden Ln
- 1114 Maiden Ln
- 1118 Maiden Ln Unit 1120
- 1112 Maiden Ln
- 1124 Maiden Ln Unit 1126
- 1108 Maiden Ln
- 1106 Maiden Ln
- 1033 Maiden Ln
- 1034 W North St
Your Personal Tour Guide
Ask me questions while you tour the home.