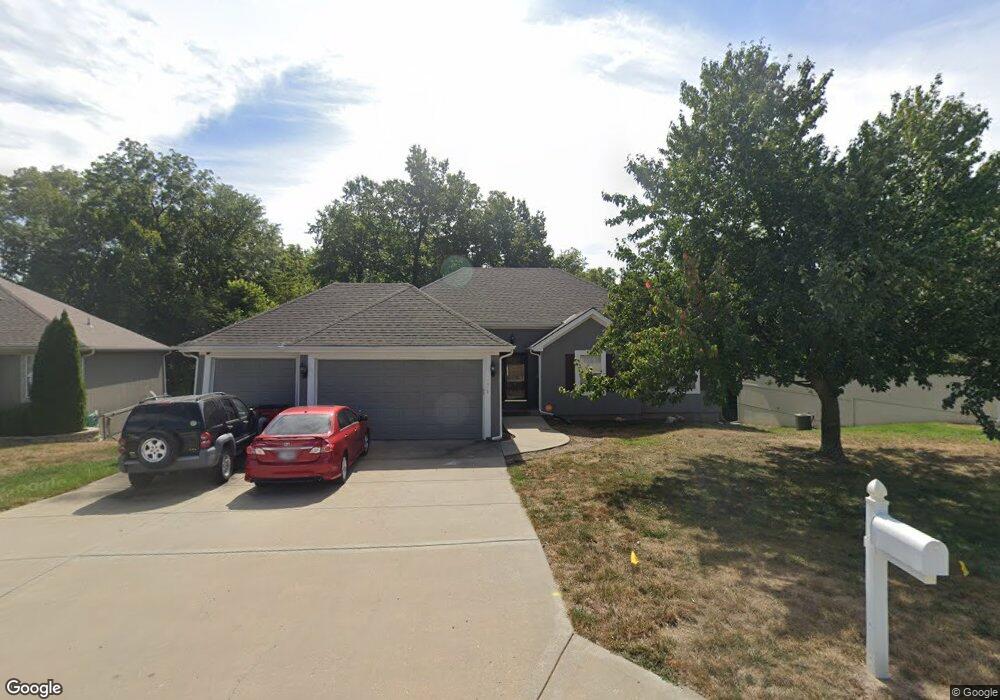
1117 N Hanover Ave Independence, MO 64056
Ripley NeighborhoodEstimated Value: $386,110 - $444,000
5
Beds
3
Baths
1,873
Sq Ft
$220/Sq Ft
Est. Value
About This Home
This home is located at 1117 N Hanover Ave, Independence, MO 64056 and is currently estimated at $412,778, approximately $220 per square foot. 1117 N Hanover Ave is a home located in Jackson County with nearby schools including Fort Osage High School.
Ownership History
Date
Name
Owned For
Owner Type
Purchase Details
Closed on
Apr 24, 2013
Sold by
Enright Kevin T and Enright Jennifer Ann
Bought by
Enright Kevin T and Enright Jennifer A
Current Estimated Value
Home Financials for this Owner
Home Financials are based on the most recent Mortgage that was taken out on this home.
Original Mortgage
$136,000
Outstanding Balance
$29,049
Interest Rate
3.67%
Mortgage Type
New Conventional
Estimated Equity
$383,729
Purchase Details
Closed on
Apr 26, 2006
Sold by
W Francis Construction Co Llc
Bought by
Enright Kevin T and Enright Jennifer Ann
Home Financials for this Owner
Home Financials are based on the most recent Mortgage that was taken out on this home.
Original Mortgage
$194,700
Interest Rate
9.25%
Mortgage Type
Fannie Mae Freddie Mac
Purchase Details
Closed on
Aug 5, 2005
Sold by
Andachter Pollard Development Llc
Bought by
W Francis Construction Co
Create a Home Valuation Report for This Property
The Home Valuation Report is an in-depth analysis detailing your home's value as well as a comparison with similar homes in the area
Home Values in the Area
Average Home Value in this Area
Purchase History
| Date | Buyer | Sale Price | Title Company |
|---|---|---|---|
| Enright Kevin T | -- | Platinum Title Llc | |
| Enright Kevin T | -- | Kansas City Title | |
| W Francis Construction Co | -- | First American Title Ins Co |
Source: Public Records
Mortgage History
| Date | Status | Borrower | Loan Amount |
|---|---|---|---|
| Open | Enright Kevin T | $136,000 | |
| Closed | Enright Kevin T | $194,700 |
Source: Public Records
Tax History
| Year | Tax Paid | Tax Assessment Tax Assessment Total Assessment is a certain percentage of the fair market value that is determined by local assessors to be the total taxable value of land and additions on the property. | Land | Improvement |
|---|---|---|---|---|
| 2025 | $5,129 | $74,267 | $6,464 | $67,803 |
| 2024 | $5,129 | $64,581 | $7,163 | $57,418 |
| 2023 | $5,104 | $64,581 | $7,163 | $57,418 |
| 2022 | $4,869 | $58,520 | $7,052 | $51,468 |
| 2021 | $4,867 | $58,520 | $7,052 | $51,468 |
| 2020 | $4,691 | $55,644 | $7,052 | $48,592 |
| 2019 | $4,646 | $55,644 | $7,052 | $48,592 |
| 2018 | $1,725,135 | $48,428 | $6,138 | $42,290 |
| 2016 | $3,634 | $47,215 | $6,840 | $40,375 |
Source: Public Records
Map
Nearby Homes
- 1305 N Holland Dr
- 1313 N Holland Dr
- 1329 N Holland Dr
- 20500 E Bundschu Rd
- 1336 N Holland Dr
- 19600 E 11th Terrace N
- 19610 E Bundschu Rd
- 1131 N Mohican Ct
- 19706 E 14th St N
- 1345 N Holland Ct
- 1317 N Holland Ct
- 1328 N Holland Ct
- 1320 N Holland Ct
- 19704 E 14th Terrace N
- 817 N Mohican Dr
- 1607 N Belvidere Ave
- 301 & 401 N Jones Rd
- 1620 N Belvidere Ave
- 658 N Mohican Dr
- 19200 E 14th St N
- 1121 N Hanover Ave
- 1113 N Hanover Ave
- 1109 N Hanover Ave
- 1125 N Hanover Ave
- 1111 N Holland Dr
- 1110 N Holland Dr
- 1129 N Hanover Ave
- 1105 N Hanover Ave
- 1124 N Hanover Ave
- 1119 N Holland Dr
- 1114 N Holland Dr
- 1133 N Hanover Ave
- 1200 N Heartland Ave
- 1118 N Holland Dr
- 1101 N Hanover Ave
- 1115 N Old Mill Rd
- 1123 N Holland Dr
- 1122 N Holland Dr
- 1201 N Hanover Ave
- 1204 N Heartland Ave
Your Personal Tour Guide
Ask me questions while you tour the home.