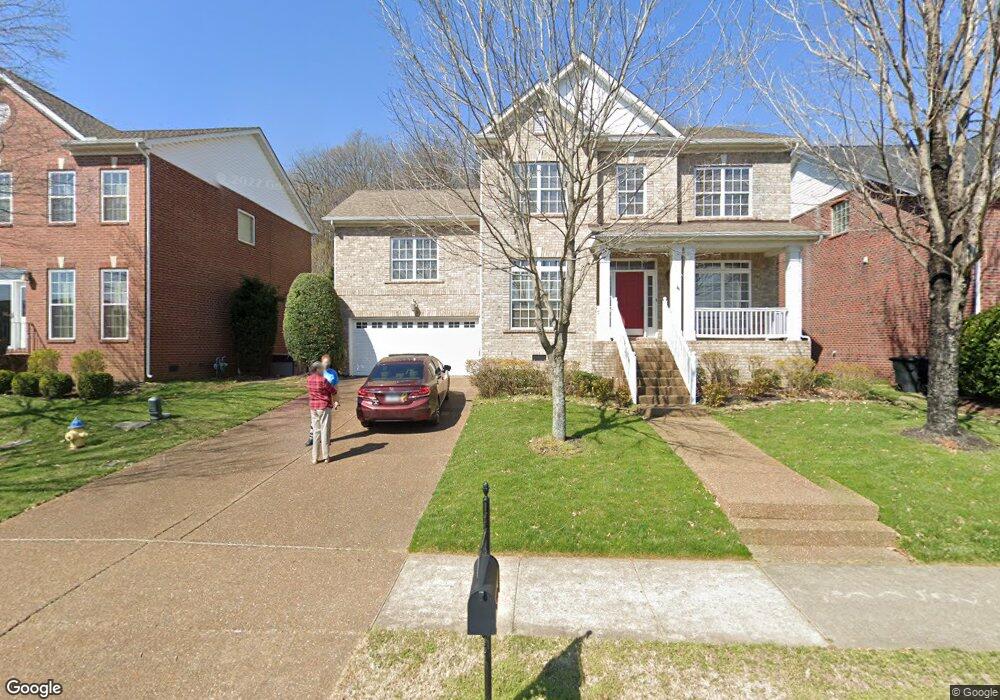
1117 Olde Cameron Ln Franklin, TN 37067
Estimated Value: $755,972 - $788,000
4
Beds
3
Baths
2,418
Sq Ft
$319/Sq Ft
Est. Value
About This Home
This home is located at 1117 Olde Cameron Ln, Franklin, TN 37067 and is currently estimated at $772,243, approximately $319 per square foot. 1117 Olde Cameron Ln is a home located in Williamson County with nearby schools including Clovercroft Elementary School, Fred J. Page Middle School, and Centennial High School.
Ownership History
Date
Name
Owned For
Owner Type
Purchase Details
Closed on
Jan 6, 2025
Sold by
Vognild Elayne D
Bought by
Elayne D Vognild Revocable Trust and Vognild
Current Estimated Value
Purchase Details
Closed on
Jan 6, 2014
Sold by
Black Carl and Black April
Bought by
Vognild Richard A and Vognild Elayne
Home Financials for this Owner
Home Financials are based on the most recent Mortgage that was taken out on this home.
Original Mortgage
$70,000
Interest Rate
4.29%
Mortgage Type
Credit Line Revolving
Purchase Details
Closed on
Oct 4, 2007
Sold by
Niesen Scott Matthew and Niesen Sandra Nerney
Bought by
Black Carl and Black April
Purchase Details
Closed on
Mar 22, 2001
Sold by
Beazer Homes Corp
Bought by
Niesen Scott Matthew and Niesen Sandra Nerney
Home Financials for this Owner
Home Financials are based on the most recent Mortgage that was taken out on this home.
Original Mortgage
$186,950
Interest Rate
7.02%
Create a Home Valuation Report for This Property
The Home Valuation Report is an in-depth analysis detailing your home's value as well as a comparison with similar homes in the area
Home Values in the Area
Average Home Value in this Area
Purchase History
| Date | Buyer | Sale Price | Title Company |
|---|---|---|---|
| Elayne D Vognild Revocable Trust | -- | None Listed On Document | |
| Vognild Richard A | $345,000 | None Available | |
| Black Carl | $309,900 | Prestige Title Llc | |
| Niesen Scott Matthew | $233,725 | -- |
Source: Public Records
Mortgage History
| Date | Status | Borrower | Loan Amount |
|---|---|---|---|
| Previous Owner | Vognild Richard A | $70,000 | |
| Previous Owner | Niesen Scott Matthew | $186,950 |
Source: Public Records
Tax History Compared to Growth
Tax History
| Year | Tax Paid | Tax Assessment Tax Assessment Total Assessment is a certain percentage of the fair market value that is determined by local assessors to be the total taxable value of land and additions on the property. | Land | Improvement |
|---|---|---|---|---|
| 2024 | $2,365 | $109,650 | $25,000 | $84,650 |
| 2023 | $2,365 | $109,650 | $25,000 | $84,650 |
| 2022 | $2,365 | $109,650 | $25,000 | $84,650 |
| 2021 | $2,365 | $109,650 | $25,000 | $84,650 |
| 2020 | $2,359 | $91,525 | $21,250 | $70,275 |
| 2019 | $2,359 | $91,525 | $21,250 | $70,275 |
| 2018 | $2,295 | $91,525 | $21,250 | $70,275 |
| 2017 | $2,277 | $91,525 | $21,250 | $70,275 |
| 2016 | $0 | $91,525 | $21,250 | $70,275 |
| 2015 | -- | $71,400 | $18,750 | $52,650 |
| 2014 | -- | $71,400 | $18,750 | $52,650 |
Source: Public Records
Map
Nearby Homes
- 4092 Clovercroft Rd
- 3025 Coral Bell Ln
- 6060 Lookaway Cir
- 6035 Lookaway Cir
- 1422 Marrimans Ct
- 1007 Poplar Farms Dr
- 1006 Poplar Farms Dr
- 1509 Liberty Pike
- 5013 Brightwood Ct
- 1019 Poplar Farms Dr
- 1033 Dunrobin Dr
- 0109 Tbd
- 1018 Poplar Farms Dr
- 4018 Brightwood Ct
- 2010 Poplar Farms Dr
- 2012 Poplar Farms Dr
- 2024 Poplar Farms Dr
- Florence 1B Plan at Poplar Farms - Classic
- Signature Lawson 1B Plan at Poplar Farms - Signature
- Signature Galloway 1A Plan at Poplar Farms - Signature
- 1119 Olde Cameron Ln
- 1115 Olde Cameron Ln
- 1121 Olde Cameron Ln
- 1113 Olde Cameron Ln
- 1114 Olde Cameron Ln
- 1112 Olde Cameron Ln
- 1123 Olde Cameron Ln
- 1111 Olde Cameron Ln
- 1110 Olde Cameron Ln
- 1203 Limerick Ln
- 1125 Olde Cameron Ln
- 1366 Tilton Dr
- 1109 Olde Cameron Ln
- 1124 Olde Cameron Ln
- 1364 Tilton Dr
- 1303 Tilton Dr
- 1305 Tilton Dr
- 1106 Old Cameron Ln
- 1307 Tilton Dr
- 1401 Harve Ct