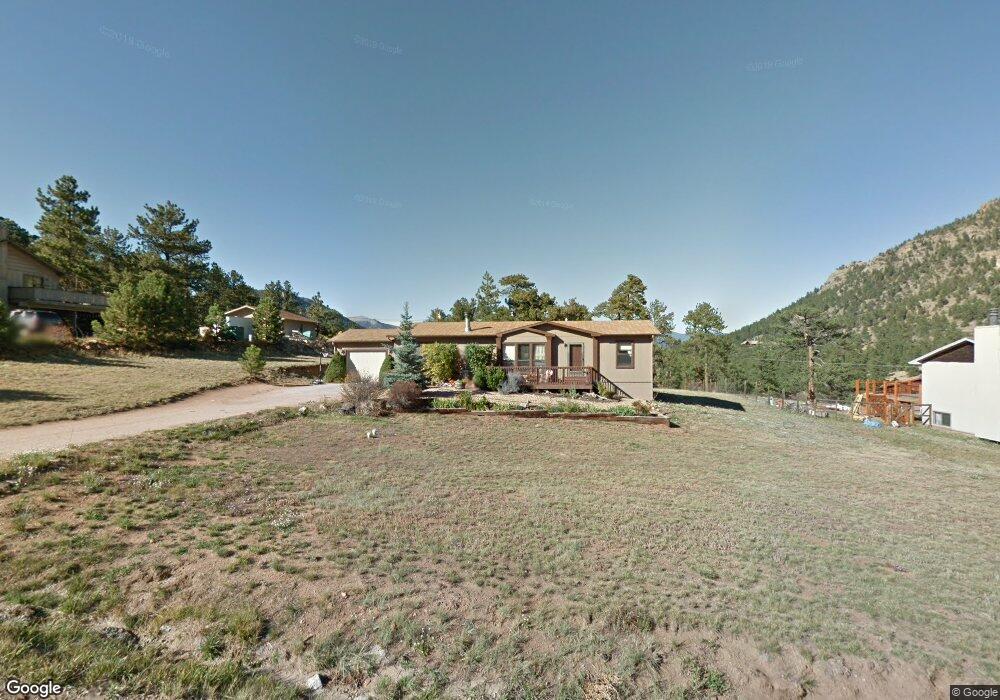
1117 Rambling Dr Estes Park, CO 80517
Estimated Value: $556,347 - $725,000
3
Beds
2
Baths
1,308
Sq Ft
$485/Sq Ft
Est. Value
About This Home
This home is located at 1117 Rambling Dr, Estes Park, CO 80517 and is currently estimated at $634,337, approximately $484 per square foot. 1117 Rambling Dr is a home located in Larimer County with nearby schools including Estes Park K-5 School, Estes Park Options School, and Estes Park Middle School.
Ownership History
Date
Name
Owned For
Owner Type
Purchase Details
Closed on
Nov 10, 2011
Sold by
Asche Kathryn S
Bought by
Asche Kathryn S and Asche Bradley W
Current Estimated Value
Home Financials for this Owner
Home Financials are based on the most recent Mortgage that was taken out on this home.
Original Mortgage
$236,000
Outstanding Balance
$160,696
Interest Rate
3.99%
Mortgage Type
New Conventional
Estimated Equity
$473,641
Purchase Details
Closed on
Jul 16, 2004
Sold by
Lissner Kathryn S and Asche Kathryn S
Bought by
Asche Kathryn S
Home Financials for this Owner
Home Financials are based on the most recent Mortgage that was taken out on this home.
Original Mortgage
$127,600
Interest Rate
6.32%
Mortgage Type
Purchase Money Mortgage
Purchase Details
Closed on
May 1, 1993
Sold by
Jones Craig D By Aif
Bought by
Lissner Kathryn S
Create a Home Valuation Report for This Property
The Home Valuation Report is an in-depth analysis detailing your home's value as well as a comparison with similar homes in the area
Home Values in the Area
Average Home Value in this Area
Purchase History
| Date | Buyer | Sale Price | Title Company |
|---|---|---|---|
| Asche Kathryn S | -- | None Available | |
| Asche Kathryn S | -- | Big Rock Title Llc | |
| Lissner Kathryn S | $86,000 | -- |
Source: Public Records
Mortgage History
| Date | Status | Borrower | Loan Amount |
|---|---|---|---|
| Open | Asche Kathryn S | $236,000 | |
| Closed | Asche Kathryn S | $127,600 |
Source: Public Records
Tax History Compared to Growth
Tax History
| Year | Tax Paid | Tax Assessment Tax Assessment Total Assessment is a certain percentage of the fair market value that is determined by local assessors to be the total taxable value of land and additions on the property. | Land | Improvement |
|---|---|---|---|---|
| 2025 | $2,786 | $37,895 | $15,276 | $22,619 |
| 2024 | $2,758 | $37,895 | $15,276 | $22,619 |
| 2022 | $2,558 | $30,254 | $11,329 | $18,925 |
| 2021 | $2,627 | $31,124 | $11,655 | $19,469 |
| 2020 | $1,671 | $19,548 | $9,295 | $10,253 |
| 2019 | $1,660 | $19,548 | $9,295 | $10,253 |
| 2018 | $1,628 | $18,648 | $7,272 | $11,376 |
| 2017 | $1,636 | $18,648 | $7,272 | $11,376 |
| 2016 | $1,435 | $16,867 | $6,766 | $10,101 |
| 2015 | $1,418 | $16,870 | $6,770 | $10,100 |
| 2014 | $1,008 | $13,240 | $9,710 | $3,530 |
Source: Public Records
Map
Nearby Homes
- 1104 Willow Ct
- 2516 Pine Meadow Dr
- 3149 Fish Creek Rd
- 2408 Longview Dr
- 2630 Ridge Ln
- 619 Whispering Pines Dr
- 2441 Spruce Ave
- 3495 Saint Francis Way
- 2319 Spruce Ave
- 0 Governors Ln Unit 1035838
- 419 Whispering Pines Dr
- 2175 Carriage Dr
- 3333 Rockwood Ln S
- 345 Green Pine Ct
- 303 Green Pine Ct
- 407 Pawnee Dr
- 125 Saddleback Ln
- 0 Moon Trailway Unit RECIR1033825
- 930 Highacres Dr
- 1440 Hummingbird Dr
- 1109 Rambling Dr
- 1125 Rambling Dr
- 1116 Rambling Dr
- 2805 Wildwood Dr
- 2731 Wildwood Dr
- 2806 Aspen Ln
- 2424 Aspen Dr
- 1133 Rambling Dr
- 2816 Aspen Ln
- 1108 Rambling Dr
- 2719 Wildwood Dr
- 1124 Rambling Dr
- 2750 Aspen Ln
- 2843 Wilderness Ln
- 2831 Wildwood Dr
- 2740 Aspen Ln
- 1020 Rambling Dr
- 2730 Wildwood Dr
- 2711 Wildwood Dr
- 2850 Aspen Dr