1117 S 10th St Terre Haute, IN 47802
South 13th Street NeighborhoodEstimated Value: $59,000 - $99,000
2
Beds
1
Bath
1,664
Sq Ft
$47/Sq Ft
Est. Value
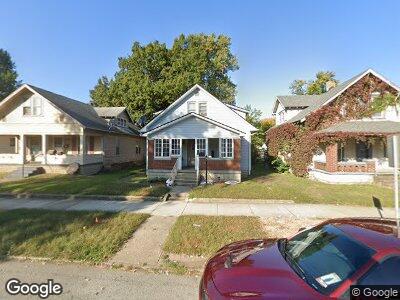
About This Home
This home is located at 1117 S 10th St, Terre Haute, IN 47802 and is currently estimated at $78,474, approximately $47 per square foot. 1117 S 10th St is a home located in Vigo County with nearby schools including Sugar Grove Elementary School, Sarah Scott Middle School, and Terre Haute South Vigo High School.
Ownership History
Date
Name
Owned For
Owner Type
Purchase Details
Closed on
May 14, 2015
Sold by
First Financial Bank Na
Bought by
F & F Property Holdin Llc
Current Estimated Value
Purchase Details
Closed on
Apr 16, 2015
Sold by
Sheriff Greg Ewing
Bought by
First Financial Bank Na
Purchase Details
Closed on
Nov 24, 2008
Sold by
Gayso Mary A and Gayso Joseph L
Bought by
Cecil John W and Cecil Bonita C
Create a Home Valuation Report for This Property
The Home Valuation Report is an in-depth analysis detailing your home's value as well as a comparison with similar homes in the area
Home Values in the Area
Average Home Value in this Area
Purchase History
| Date | Buyer | Sale Price | Title Company |
|---|---|---|---|
| F & F Property Holdin Llc | $9,000 | -- | |
| First Financial Bank Na | $14,600 | -- | |
| Cecil John W | -- | -- |
Source: Public Records
Mortgage History
| Date | Status | Borrower | Loan Amount |
|---|---|---|---|
| Open | F & F Property Holdings Llc | $30,000 | |
| Previous Owner | Cecil John W | $29,500 |
Source: Public Records
Tax History Compared to Growth
Tax History
| Year | Tax Paid | Tax Assessment Tax Assessment Total Assessment is a certain percentage of the fair market value that is determined by local assessors to be the total taxable value of land and additions on the property. | Land | Improvement |
|---|---|---|---|---|
| 2024 | $807 | $37,300 | $4,400 | $32,900 |
| 2023 | $804 | $37,200 | $5,200 | $32,000 |
| 2022 | $804 | $37,200 | $5,000 | $32,200 |
| 2021 | $804 | $37,200 | $5,100 | $32,100 |
| 2020 | $804 | $37,200 | $5,100 | $32,100 |
| 2019 | $803 | $37,200 | $5,100 | $32,100 |
| 2018 | $1,047 | $34,900 | $4,800 | $30,100 |
| 2017 | $682 | $34,100 | $4,700 | $29,400 |
| 2016 | $690 | $34,500 | $4,700 | $29,800 |
| 2014 | $586 | $58,600 | $8,200 | $50,400 |
| 2013 | $586 | $57,500 | $8,100 | $49,400 |
Source: Public Records
Map
Nearby Homes