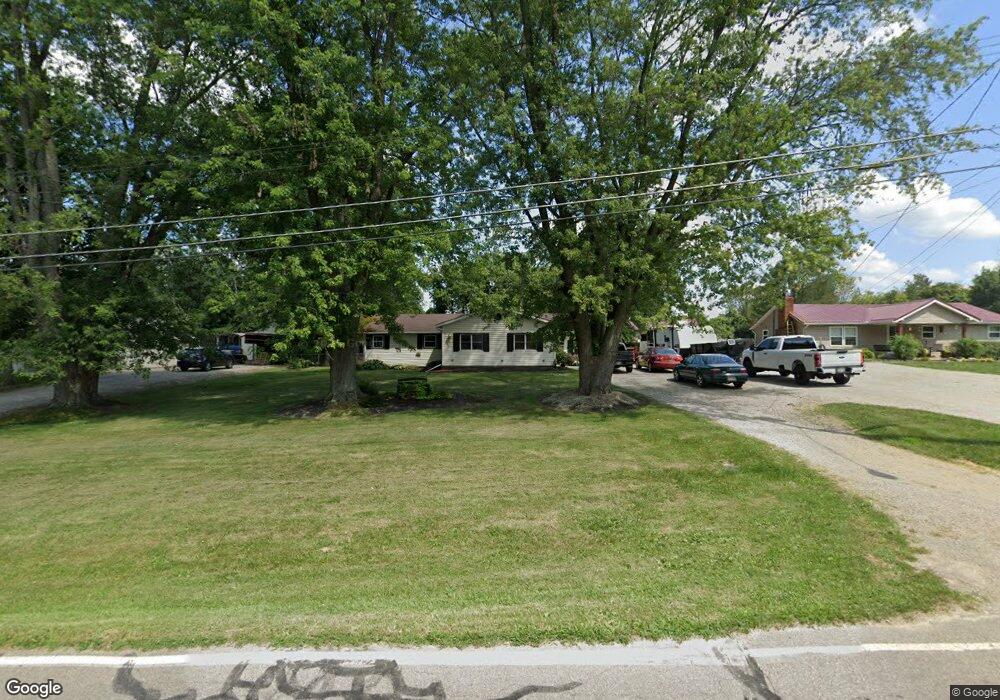
1117 Shawhan Rd Morrow, OH 45152
Estimated Value: $238,000 - $401,000
4
Beds
2
Baths
1,586
Sq Ft
$184/Sq Ft
Est. Value
About This Home
This home is located at 1117 Shawhan Rd, Morrow, OH 45152 and is currently estimated at $292,070, approximately $184 per square foot. 1117 Shawhan Rd is a home located in Warren County with nearby schools including Kings Junior High School and Kings High School.
Ownership History
Date
Name
Owned For
Owner Type
Purchase Details
Closed on
Sep 23, 2003
Sold by
David Tamala L and David William
Bought by
David William and David Tamala L
Current Estimated Value
Home Financials for this Owner
Home Financials are based on the most recent Mortgage that was taken out on this home.
Original Mortgage
$117,000
Outstanding Balance
$58,861
Interest Rate
7.99%
Mortgage Type
Purchase Money Mortgage
Estimated Equity
$233,210
Purchase Details
Closed on
Aug 16, 1995
Sold by
Mcdonald John E
Bought by
Patton Tamala L
Home Financials for this Owner
Home Financials are based on the most recent Mortgage that was taken out on this home.
Original Mortgage
$38,000
Interest Rate
7.64%
Mortgage Type
New Conventional
Purchase Details
Closed on
Aug 5, 1988
Sold by
Kattine Robert S and Kattine Beve
Bought by
Mcdonald and Mcdonald John E
Create a Home Valuation Report for This Property
The Home Valuation Report is an in-depth analysis detailing your home's value as well as a comparison with similar homes in the area
Home Values in the Area
Average Home Value in this Area
Purchase History
| Date | Buyer | Sale Price | Title Company |
|---|---|---|---|
| David William | -- | Titlecare Closing Company | |
| Patton Tamala L | $60,000 | -- | |
| Mcdonald | $52,500 | -- |
Source: Public Records
Mortgage History
| Date | Status | Borrower | Loan Amount |
|---|---|---|---|
| Open | David William | $117,000 | |
| Closed | Patton Tamala L | $38,000 |
Source: Public Records
Tax History
| Year | Tax Paid | Tax Assessment Tax Assessment Total Assessment is a certain percentage of the fair market value that is determined by local assessors to be the total taxable value of land and additions on the property. | Land | Improvement |
|---|---|---|---|---|
| 2025 | $3,475 | $67,480 | $21,880 | $45,600 |
| 2024 | $3,475 | $67,480 | $21,880 | $45,600 |
| 2023 | $2,887 | $50,354 | $10,587 | $39,767 |
| 2022 | $2,854 | $50,355 | $10,588 | $39,767 |
| 2021 | $2,391 | $50,355 | $10,588 | $39,767 |
| 2020 | $2,362 | $41,615 | $8,750 | $32,865 |
| 2019 | $2,394 | $41,615 | $8,750 | $32,865 |
| 2018 | $2,400 | $41,615 | $8,750 | $32,865 |
| 2017 | $2,566 | $39,596 | $8,449 | $31,147 |
| 2016 | $2,475 | $39,596 | $8,449 | $31,147 |
| 2015 | $2,239 | $39,596 | $8,449 | $31,147 |
| 2014 | $2,212 | $37,010 | $7,900 | $29,110 |
| 2013 | $2,205 | $41,010 | $8,750 | $32,260 |
Source: Public Records
Map
Nearby Homes
- 1199 Shawhan Rd
- 960 Oak Ridge Ln
- 905 Garden View Cir
- 952 Lavender Way
- 1017 Garden View Cir
- 3205 Garden View Ct
- 998 Larkspur Dr
- 1212 Arapaho Dr
- 962 Larkspur Dr
- 0 Arapaho Dr
- 3159 Rosemary Ct
- 3180 Sage Ct
- 507 Shawhan Rd
- 430 Mary Ln
- 365 Sunset Dr
- 439 Morrow Rd Unit 88
- 396 Mary Lane Cir
- 483 Valley View Dr
- 309 King Ave
- 801 Frederick Trail
- 1109 Shawhan Rd
- 1129 Shawhan Rd
- 1139 Shawhan Rd
- 1101 Shawhan Rd
- 1149 Shawhan Rd
- 1189 Shawhan Rd
- 1116 Shawhan Rd
- 1073 Shawhan Rd
- 1117 Cheyenne Ct
- 1140 Cheyenne Ct
- 1215 Shawhan Rd
- 1063 Shawhan Rd
- 959 Oak Ridge Ln
- 965 Oak Ridge Ln
- 953 Oak Ridge Ln
- 1062 Shawhan Rd
- 36 Cheyenne Ct
- 1090 Shawnee Dr
- Lot36 Cheyenne Ct
- 38 Cheyenne Ct
Your Personal Tour Guide
Ask me questions while you tour the home.