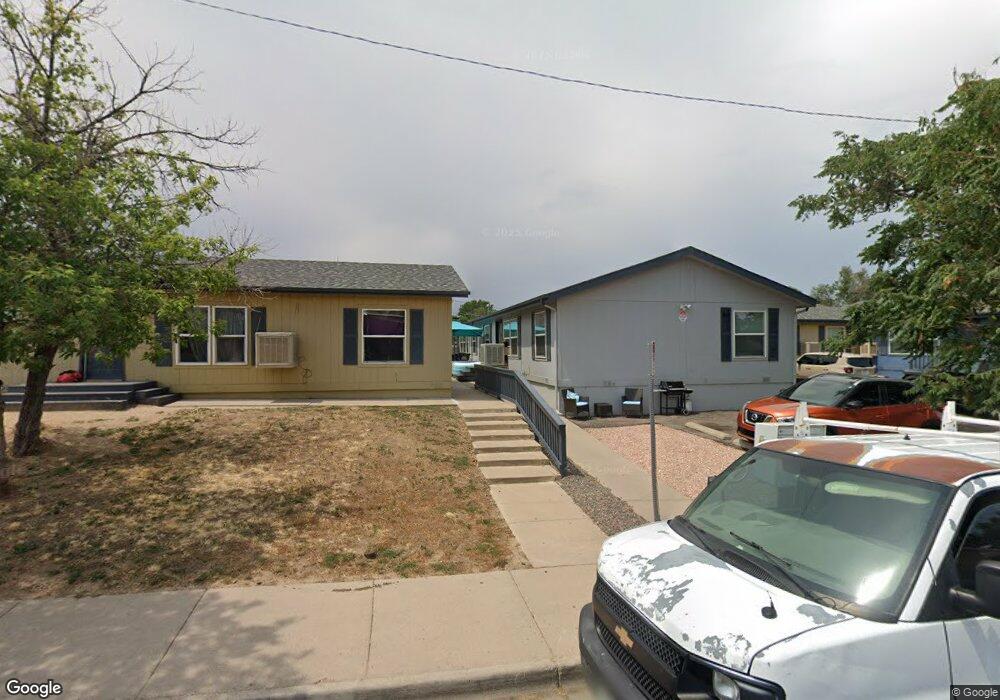
1117 Xanthia St Denver, CO 80220
East Colfax NeighborhoodEstimated Value: $319,428 - $364,000
3
Beds
1
Bath
1,067
Sq Ft
$326/Sq Ft
Est. Value
About This Home
This home is located at 1117 Xanthia St, Denver, CO 80220 and is currently estimated at $347,607, approximately $325 per square foot. 1117 Xanthia St is a home located in Denver County with nearby schools including Montclair School of Academics and Enrichment, Hill Campus of Arts & Sciences, and George Washington High School.
Ownership History
Date
Name
Owned For
Owner Type
Purchase Details
Closed on
Jan 28, 2009
Sold by
Us Bank National Association
Bought by
The Villas At Westerly Creek Llc
Current Estimated Value
Home Financials for this Owner
Home Financials are based on the most recent Mortgage that was taken out on this home.
Original Mortgage
$34,300
Outstanding Balance
$23,381
Interest Rate
6.62%
Mortgage Type
Purchase Money Mortgage
Estimated Equity
$324,226
Purchase Details
Closed on
Jul 28, 2008
Sold by
Thomas Carrie L and Thomas Brian D
Bought by
Us Bank Na and Csmc Mortgage Backed Pass Through Certif
Purchase Details
Closed on
Dec 13, 2004
Sold by
Rothschild Investments Llc
Bought by
Thomas Brian D and Thomas Carrie L
Home Financials for this Owner
Home Financials are based on the most recent Mortgage that was taken out on this home.
Original Mortgage
$15,100
Interest Rate
7%
Mortgage Type
Purchase Money Mortgage
Create a Home Valuation Report for This Property
The Home Valuation Report is an in-depth analysis detailing your home's value as well as a comparison with similar homes in the area
Home Values in the Area
Average Home Value in this Area
Purchase History
| Date | Buyer | Sale Price | Title Company |
|---|---|---|---|
| The Villas At Westerly Creek Llc | $49,000 | None Available | |
| Us Bank Na | -- | None Available | |
| Thomas Brian D | -- | Chicago Title Co |
Source: Public Records
Mortgage History
| Date | Status | Borrower | Loan Amount |
|---|---|---|---|
| Open | The Villas At Westerly Creek Llc | $34,300 | |
| Previous Owner | Thomas Brian D | $15,100 |
Source: Public Records
Tax History Compared to Growth
Tax History
| Year | Tax Paid | Tax Assessment Tax Assessment Total Assessment is a certain percentage of the fair market value that is determined by local assessors to be the total taxable value of land and additions on the property. | Land | Improvement |
|---|---|---|---|---|
| 2024 | $1,567 | $19,790 | $3,120 | $16,670 |
| 2023 | $1,533 | $19,790 | $3,120 | $16,670 |
| 2022 | $1,683 | $21,160 | $1,950 | $19,210 |
| 2021 | $1,624 | $21,760 | $2,000 | $19,760 |
| 2020 | $1,436 | $19,350 | $2,000 | $17,350 |
| 2019 | $1,395 | $19,350 | $2,000 | $17,350 |
| 2018 | $1,048 | $13,550 | $2,020 | $11,530 |
| 2017 | $1,045 | $13,550 | $2,020 | $11,530 |
| 2016 | $992 | $12,160 | $1,337 | $10,823 |
| 2015 | $950 | $12,160 | $1,337 | $10,823 |
| 2014 | $353 | $4,250 | $1,186 | $3,064 |
Source: Public Records
Map
Nearby Homes
- 1143 Akron St
- 1111 Wabash St
- 1159 Akron St
- 1175 Akron St
- 1193 Akron St
- 1277 Wabash St
- 1210 Alton St
- 1320 Willow St
- 1325 Wabash St
- 1195 Boston St
- 1067 Uinta Way Unit 1067
- 8105 E 11th Ave Unit 2B
- 1132 Boston St
- 1264 Uinta St
- 1000 Ulster St
- 1416 Willow St
- 9011 E 14th Ave
- 1444 Willow St
- 1272 Ulster St
- 8200 E 8th Ave Unit 1203
- 1121 Xanthia St
- 1111 Xanthia St
- 1113 Xanthia St
- 1119 Xanthia St
- 1119 Xanthia St
- 1123 Xanthia St
- 1115 Xanthia St
- 1115 Xanthia St
- 8701 E 11th Ave Unit 8703
- 1101 Xanthia St
- 8703 E 11th Ave
- 1108 Xanthia St Unit 1114
- 8705 E 11th Ave Unit 8707
- 8707 E 11th Ave
- 1120 Willow St
- 1124 Willow St
- 1120 Willow St Unit 6886875-11438698
- 1130 Willow St
- 1130 Willow St
- 1126 Willow St