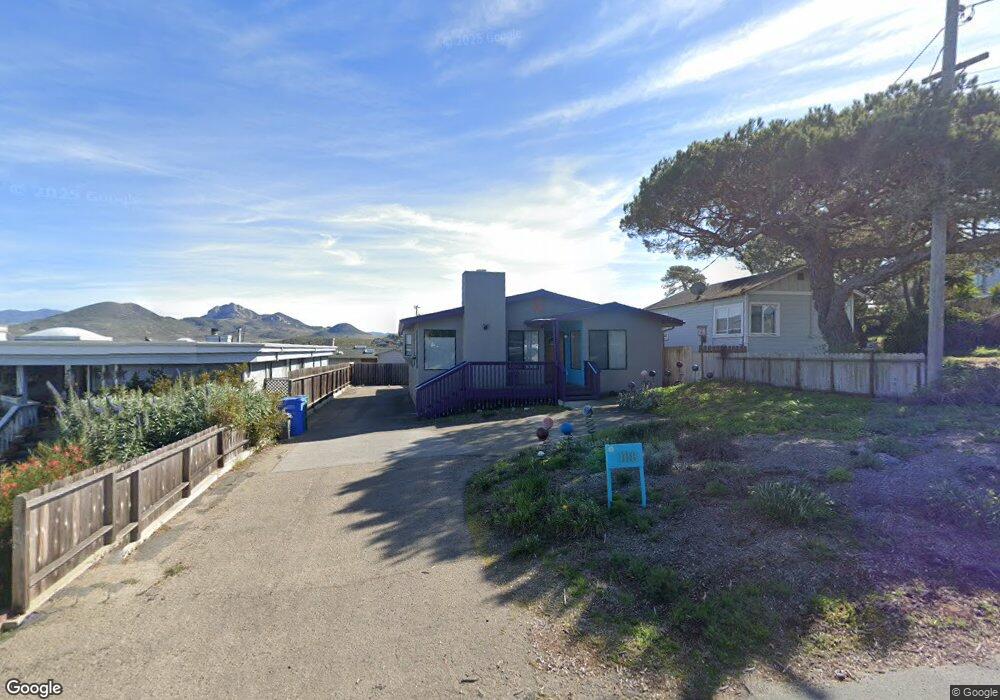
1118 3rd St Los Osos, CA 93402
Estimated Value: $855,603 - $981,000
3
Beds
2
Baths
1,200
Sq Ft
$751/Sq Ft
Est. Value
About This Home
This home is located at 1118 3rd St, Los Osos, CA 93402 and is currently estimated at $901,151, approximately $750 per square foot. 1118 3rd St is a home located in San Luis Obispo County with nearby schools including Baywood Elementary School, Los Osos Middle School, and Morro Bay High School.
Ownership History
Date
Name
Owned For
Owner Type
Purchase Details
Closed on
Nov 6, 2012
Sold by
Bostwick Lorna
Bought by
Bostwick Lorna
Current Estimated Value
Home Financials for this Owner
Home Financials are based on the most recent Mortgage that was taken out on this home.
Original Mortgage
$169,500
Outstanding Balance
$116,429
Interest Rate
3.34%
Mortgage Type
New Conventional
Estimated Equity
$784,722
Purchase Details
Closed on
Oct 23, 2012
Sold by
Bostwick Lorna
Bought by
Bostwick Lorna
Home Financials for this Owner
Home Financials are based on the most recent Mortgage that was taken out on this home.
Original Mortgage
$169,500
Outstanding Balance
$116,429
Interest Rate
3.34%
Mortgage Type
New Conventional
Estimated Equity
$784,722
Purchase Details
Closed on
Jan 2, 2009
Sold by
Bostwick Lorna
Bought by
Bostwick Lorna
Home Financials for this Owner
Home Financials are based on the most recent Mortgage that was taken out on this home.
Original Mortgage
$177,000
Interest Rate
5.6%
Mortgage Type
New Conventional
Purchase Details
Closed on
Aug 27, 2004
Sold by
Bostwick Lorna
Bought by
Bostwick Lorna
Purchase Details
Closed on
Sep 30, 1999
Sold by
Price Kenneth and Price Barbara L
Bought by
Bostwick Lorna
Home Financials for this Owner
Home Financials are based on the most recent Mortgage that was taken out on this home.
Original Mortgage
$189,000
Interest Rate
7.82%
Purchase Details
Closed on
May 19, 1998
Sold by
Price Kenneth and Price Barbara L
Bought by
Price Kenneth and Price Barbara L
Purchase Details
Closed on
May 15, 1998
Sold by
Price Kenneth
Bought by
Price Kenneth and Price Barbara L
Purchase Details
Closed on
May 13, 1998
Sold by
Price Kenneth and Broshears Lee
Bought by
Price Kenneth
Purchase Details
Closed on
May 26, 1995
Sold by
Cassity Mabel
Bought by
Cassity Mabel
Create a Home Valuation Report for This Property
The Home Valuation Report is an in-depth analysis detailing your home's value as well as a comparison with similar homes in the area
Home Values in the Area
Average Home Value in this Area
Purchase History
| Date | Buyer | Sale Price | Title Company |
|---|---|---|---|
| Bostwick Lorna | -- | None Available | |
| Bostwick Lorna | -- | First American Title Company | |
| Bostwick Lorna | -- | First American Title Company | |
| Bostwick Lorna | -- | First American Title Company | |
| Bostwick Lorna | -- | -- | |
| Bostwick Lorna | $239,000 | Fidelity National Title Co | |
| Price Kenneth | -- | -- | |
| Price Kenneth | -- | -- | |
| Price Kenneth | -- | -- | |
| Cassity Mabel | -- | -- |
Source: Public Records
Mortgage History
| Date | Status | Borrower | Loan Amount |
|---|---|---|---|
| Open | Bostwick Lorna | $169,500 | |
| Closed | Bostwick Lorna | $177,000 | |
| Closed | Bostwick Lorna | $189,000 |
Source: Public Records
Tax History
| Year | Tax Paid | Tax Assessment Tax Assessment Total Assessment is a certain percentage of the fair market value that is determined by local assessors to be the total taxable value of land and additions on the property. | Land | Improvement |
|---|---|---|---|---|
| 2025 | $6,648 | $381,763 | $184,425 | $197,338 |
| 2024 | $6,535 | $374,278 | $180,809 | $193,469 |
| 2023 | $6,535 | $366,940 | $177,264 | $189,676 |
| 2022 | $6,294 | $359,746 | $173,789 | $185,957 |
| 2021 | $6,222 | $352,693 | $170,382 | $182,311 |
| 2020 | $5,797 | $349,077 | $168,635 | $180,442 |
| 2019 | $5,844 | $342,233 | $165,329 | $176,904 |
| 2018 | $5,752 | $335,524 | $162,088 | $173,436 |
| 2017 | $5,623 | $328,946 | $158,910 | $170,036 |
| 2016 | $4,430 | $322,497 | $155,795 | $166,702 |
| 2015 | $4,377 | $317,653 | $153,455 | $164,198 |
| 2014 | $4,092 | $311,432 | $150,450 | $160,982 |
Source: Public Records
Map
Nearby Homes
- 1247 3rd St
- 1107 Pasadena Dr
- 0 Pasadena Dr Unit SC26007383
- 0 Pasadena Dr Unit 226009679
- 0 Pasadena Dr Unit 18798331
- 768 El Morro Ave
- 914 El Morro Ave
- 1168 10th St
- 1420 5th St
- 1412 5th St
- 1540 7th St
- 1527 11th St
- 1421 13th St
- 1705 5th St
- 1565 11th St
- 1455 13th St
- 1701 8th St
- 1231 10th St
- 1266 10th St
- 1298 15th St
Your Personal Tour Guide
Ask me questions while you tour the home.