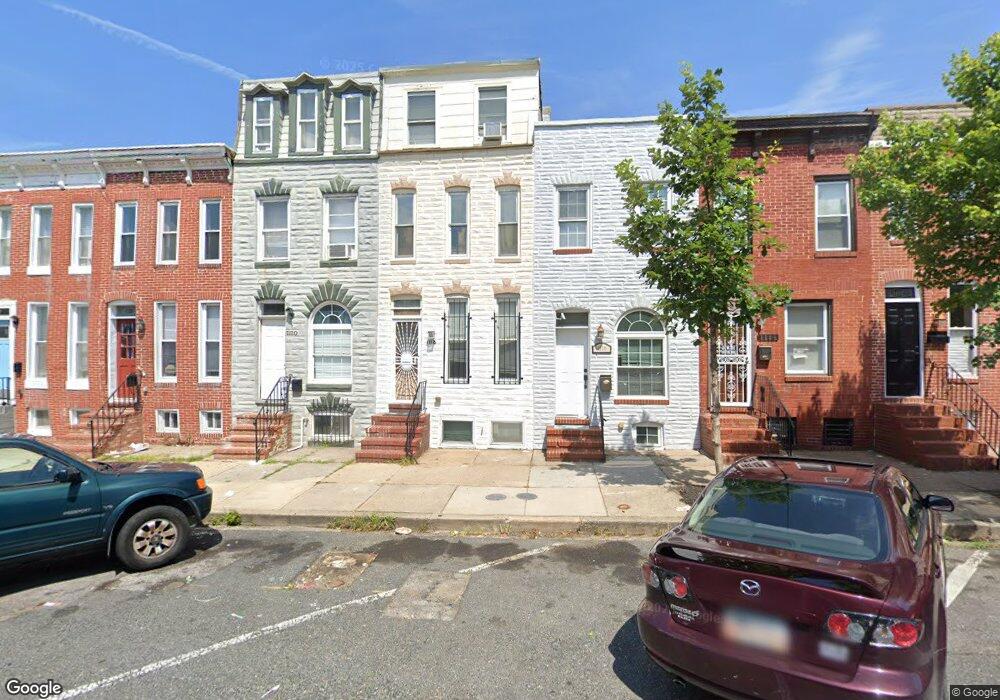
1118 Carroll St Baltimore, MD 21230
Pigtown NeighborhoodEstimated Value: $172,215 - $220,000
3
Beds
1
Bath
1,224
Sq Ft
$160/Sq Ft
Est. Value
About This Home
This home is located at 1118 Carroll St, Baltimore, MD 21230 and is currently estimated at $196,108, approximately $160 per square foot. 1118 Carroll St is a home located in Baltimore City with nearby schools including George Washington Elementary School, Booker T. Washington Middle School, and Paul Laurence Dunbar High School.
Ownership History
Date
Name
Owned For
Owner Type
Purchase Details
Closed on
Dec 30, 2019
Sold by
Pigtown Portfolio Llc
Bought by
Pigtown Portfolio Ii Llc
Current Estimated Value
Purchase Details
Closed on
Jan 31, 2018
Sold by
Charm City Housing Llc
Bought by
Pigtown Portfolio Llc
Purchase Details
Closed on
Aug 2, 2010
Sold by
Federal National Mortgage Association
Bought by
Charm City Housing Llc
Purchase Details
Closed on
Jun 14, 2010
Sold by
Johnson Shannon
Bought by
Federal National Mortgage Association
Purchase Details
Closed on
Dec 1, 2005
Sold by
Dorsey Shannon
Bought by
Johnson Shannon
Purchase Details
Closed on
Jun 16, 1997
Sold by
Maryland Housing Fund Of The
Bought by
Dorsey Shannon
Purchase Details
Closed on
Jun 23, 1995
Sold by
Cohn Edward S
Bought by
Maryland Housing Fund
Create a Home Valuation Report for This Property
The Home Valuation Report is an in-depth analysis detailing your home's value as well as a comparison with similar homes in the area
Home Values in the Area
Average Home Value in this Area
Purchase History
| Date | Buyer | Sale Price | Title Company |
|---|---|---|---|
| Pigtown Portfolio Ii Llc | -- | Residential T&E Co | |
| Pigtown Portfolio Llc | $4,552,396 | Title Town Settlement Llc | |
| Charm City Housing Llc | $43,000 | -- | |
| Federal National Mortgage Association | $112,911 | -- | |
| Johnson Shannon | -- | -- | |
| Dorsey Shannon | $39,990 | -- | |
| Maryland Housing Fund | $33,000 | -- |
Source: Public Records
Tax History Compared to Growth
Tax History
| Year | Tax Paid | Tax Assessment Tax Assessment Total Assessment is a certain percentage of the fair market value that is determined by local assessors to be the total taxable value of land and additions on the property. | Land | Improvement |
|---|---|---|---|---|
| 2025 | $2,880 | $132,900 | -- | -- |
| 2024 | $2,880 | $122,600 | $0 | $0 |
| 2023 | $2,638 | $112,300 | $40,000 | $72,300 |
| 2022 | $2,607 | $110,467 | $0 | $0 |
| 2021 | $2,564 | $108,633 | $0 | $0 |
| 2020 | $2,520 | $106,800 | $40,000 | $66,800 |
| 2019 | $2,508 | $106,800 | $40,000 | $66,800 |
| 2018 | $2,520 | $106,800 | $40,000 | $66,800 |
| 2017 | $2,608 | $110,500 | $0 | $0 |
| 2016 | $2,574 | $99,600 | $0 | $0 |
| 2015 | $2,574 | $88,700 | $0 | $0 |
| 2014 | $2,574 | $77,800 | $0 | $0 |
Source: Public Records
Map
Nearby Homes
- 1121 Ward St
- 1110 Carroll St
- 1121 Washington Blvd
- 1115 Carroll St
- 1145 W Cross St
- 1121 Sargeant St
- 1127 Sargeant St
- 930 Washington Blvd
- 1103 Sargeant St
- 1147 Sargeant St
- 1303 W Cross St
- 864 Carroll St
- 1209 Carroll St
- 1213 Washington Blvd
- 1122 Sargeant St
- 847 Reinhart St
- 884 Washington Blvd
- 1231 Carroll St
- 1202 Sargeant St
- 626 Archer St
- 1116 Carroll St
- 1114 Carroll St
- 1112 Carroll St
- 1120 Carroll St
- 1122 Carroll St
- 1108 Carroll St
- 1124 Carroll St
- 1106 Carroll St
- 1126 Carroll St
- 1104 Carroll St
- 1128 Carroll St
- 1130 Carroll St
- 1102 Carroll St
- 1115 Ward St
- 1113 Ward St
- 1117 Ward St
- 1119 Ward St
- 1111 Ward St
- 1109 Ward St
- 1132 Carroll St