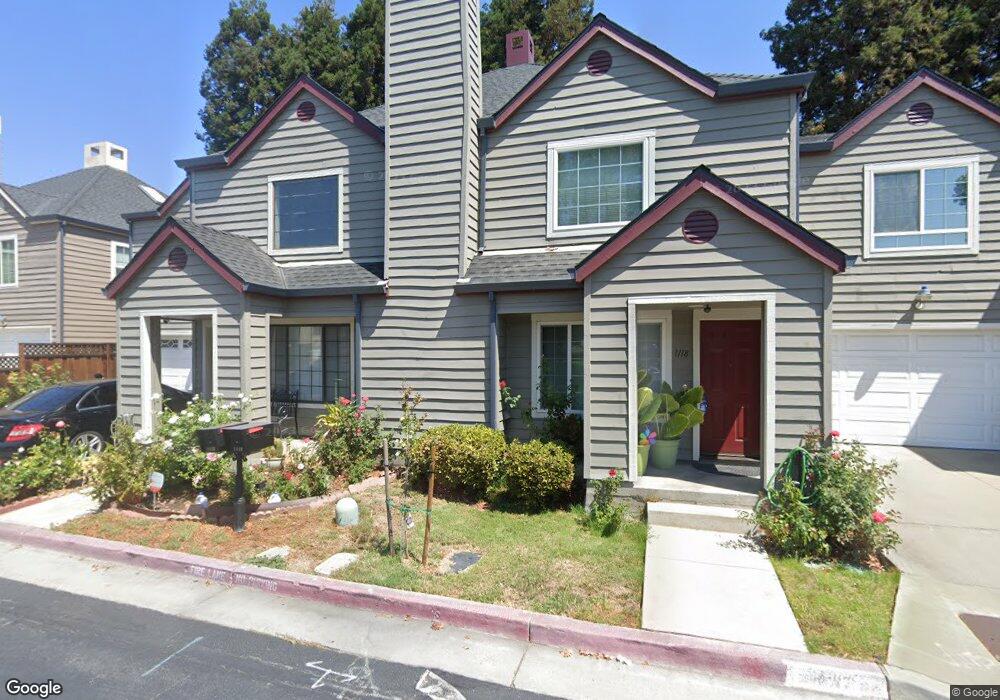
1118 Chen St San Jose, CA 95131
Vinci NeighborhoodEstimated Value: $1,164,124 - $1,364,000
3
Beds
3
Baths
1,666
Sq Ft
$745/Sq Ft
Est. Value
About This Home
This home is located at 1118 Chen St, San Jose, CA 95131 and is currently estimated at $1,241,031, approximately $744 per square foot. 1118 Chen St is a home located in Santa Clara County with nearby schools including Vinci Park Elementary School, Morrill Middle School, and Independence High School.
Ownership History
Date
Name
Owned For
Owner Type
Purchase Details
Closed on
Jul 1, 1999
Sold by
Wendy Hong and Wendy Gilbert H
Bought by
Dominguez Frank
Current Estimated Value
Home Financials for this Owner
Home Financials are based on the most recent Mortgage that was taken out on this home.
Original Mortgage
$165,000
Outstanding Balance
$45,051
Interest Rate
7.24%
Estimated Equity
$1,195,981
Create a Home Valuation Report for This Property
The Home Valuation Report is an in-depth analysis detailing your home's value as well as a comparison with similar homes in the area
Home Values in the Area
Average Home Value in this Area
Purchase History
| Date | Buyer | Sale Price | Title Company |
|---|---|---|---|
| Dominguez Frank | $310,000 | Chicago Title Co |
Source: Public Records
Mortgage History
| Date | Status | Borrower | Loan Amount |
|---|---|---|---|
| Open | Dominguez Frank | $165,000 |
Source: Public Records
Tax History
| Year | Tax Paid | Tax Assessment Tax Assessment Total Assessment is a certain percentage of the fair market value that is determined by local assessors to be the total taxable value of land and additions on the property. | Land | Improvement |
|---|---|---|---|---|
| 2025 | $7,410 | $476,436 | $190,572 | $285,864 |
| 2024 | $7,410 | $467,095 | $186,836 | $280,259 |
| 2023 | $7,260 | $457,937 | $183,173 | $274,764 |
| 2022 | $7,228 | $448,959 | $179,582 | $269,377 |
| 2021 | $6,979 | $440,157 | $176,061 | $264,096 |
| 2020 | $6,750 | $435,645 | $174,256 | $261,389 |
| 2019 | $6,490 | $427,104 | $170,840 | $256,264 |
| 2018 | $6,392 | $418,731 | $167,491 | $251,240 |
| 2017 | $6,420 | $410,521 | $164,207 | $246,314 |
| 2016 | $6,151 | $402,473 | $160,988 | $241,485 |
| 2015 | $6,077 | $396,428 | $158,570 | $237,858 |
| 2014 | $5,473 | $388,663 | $155,464 | $233,199 |
Source: Public Records
Map
Nearby Homes
- 1131 Chen St
- 1146 Rosebriar Way
- 1712 Heavenly Bamboo Ct
- 1153 Rosebriar Way
- 1729 Maysong Ct
- 1038 Giacomo Ln
- 1011 Giacomo Ln Unit 1
- 1573 de Rome Dr Unit 1
- 1291 Royal Crest Dr
- 1021 Onofrio Ln Unit 3
- 1013 Onofrio Ln Unit 2
- 1682 Commodore Dr
- 1567 Thornbriar Dr
- 1053 Eagle Way
- 1034 Ribisi Cir
- 1325 Araujo St
- 1337 Araujo St
- 1683 Marco Way
- 1135 Pandolfi Place
- 1136 Ribisi Cir
- 1116 Chen St
- 1120 Chen St
- 1734 Winston St
- 1732 Winston St
- 1727 Winston St
- 1122 Chen St
- 1730 Winston St
- 1724 Holin St
- 1725 Winston St
- 1728 Winston St
- 1124 Chen St
- 1722 Holin St
- 1723 Winston St
- 1726 Winston St
- 1126 Chen St
- 1720 Holin St
- 1724 Winston St
- 1109 Autumnsong Way
- 1721 Winston St
- 1752 River Birch Dr
Your Personal Tour Guide
Ask me questions while you tour the home.