Estimated Value: $221,676 - $233,000
--
Bed
1
Bath
1,248
Sq Ft
$181/Sq Ft
Est. Value
About This Home
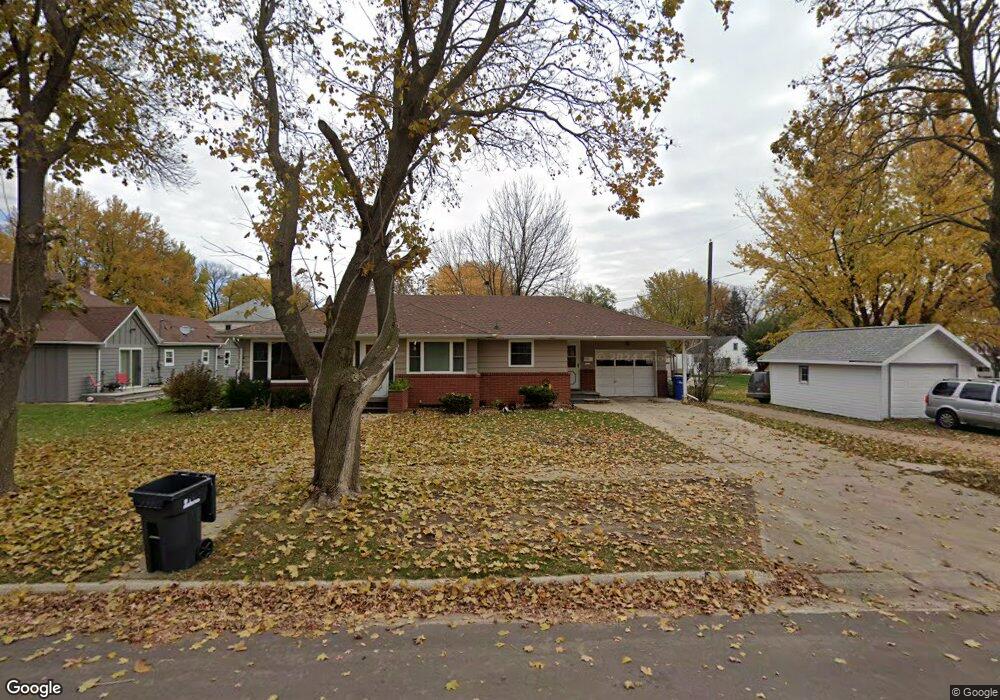
This home is located at 1118 Elm St, Hull, IA 51239 and is currently estimated at $225,669, approximately $180 per square foot. 1118 Elm St is a home located in Sioux County with nearby schools including Boyden-Hull Elementary School, Boyden-Hull High School, and Hull Christian School.
Ownership History
Date
Name
Owned For
Owner Type
Purchase Details
Closed on
Jul 4, 2016
Sold by
Koster Philip J De and Koster Rosalyn M De
Bought by
Gonzalez Martin and Gonzalez Maria Elisa
Current Estimated Value
Purchase Details
Closed on
Aug 30, 2013
Sold by
Burggraaf James A and Burggraaf Joyce A
Bought by
Dekoster Philip J and Dehaan Rosalyn M
Home Financials for this Owner
Home Financials are based on the most recent Mortgage that was taken out on this home.
Original Mortgage
$96,000
Interest Rate
4.33%
Mortgage Type
New Conventional
Create a Home Valuation Report for This Property
The Home Valuation Report is an in-depth analysis detailing your home's value as well as a comparison with similar homes in the area
Home Values in the Area
Average Home Value in this Area
Purchase History
| Date | Buyer | Sale Price | Title Company |
|---|---|---|---|
| Gonzalez Martin | $138,000 | None Available | |
| Dekoster Philip J | $120,000 | None Available |
Source: Public Records
Mortgage History
| Date | Status | Borrower | Loan Amount |
|---|---|---|---|
| Previous Owner | Dekoster Philip J | $96,000 |
Source: Public Records
Tax History Compared to Growth
Tax History
| Year | Tax Paid | Tax Assessment Tax Assessment Total Assessment is a certain percentage of the fair market value that is determined by local assessors to be the total taxable value of land and additions on the property. | Land | Improvement |
|---|---|---|---|---|
| 2025 | $2,682 | $221,590 | $18,160 | $203,430 |
| 2024 | $2,682 | $186,950 | $18,160 | $168,790 |
| 2023 | $2,642 | $186,950 | $18,160 | $168,790 |
| 2022 | $2,514 | $154,810 | $18,160 | $136,650 |
| 2021 | $2,388 | $154,540 | $18,160 | $136,380 |
| 2020 | $2,388 | $140,070 | $18,160 | $121,910 |
| 2019 | $2,226 | $129,480 | $7,570 | $121,910 |
| 2018 | $2,268 | $129,480 | $7,570 | $121,910 |
| 2017 | $2,268 | $129,480 | $7,570 | $121,910 |
| 2014 | $1,734 | $102,000 | $0 | $0 |
Source: Public Records
Map
Nearby Homes