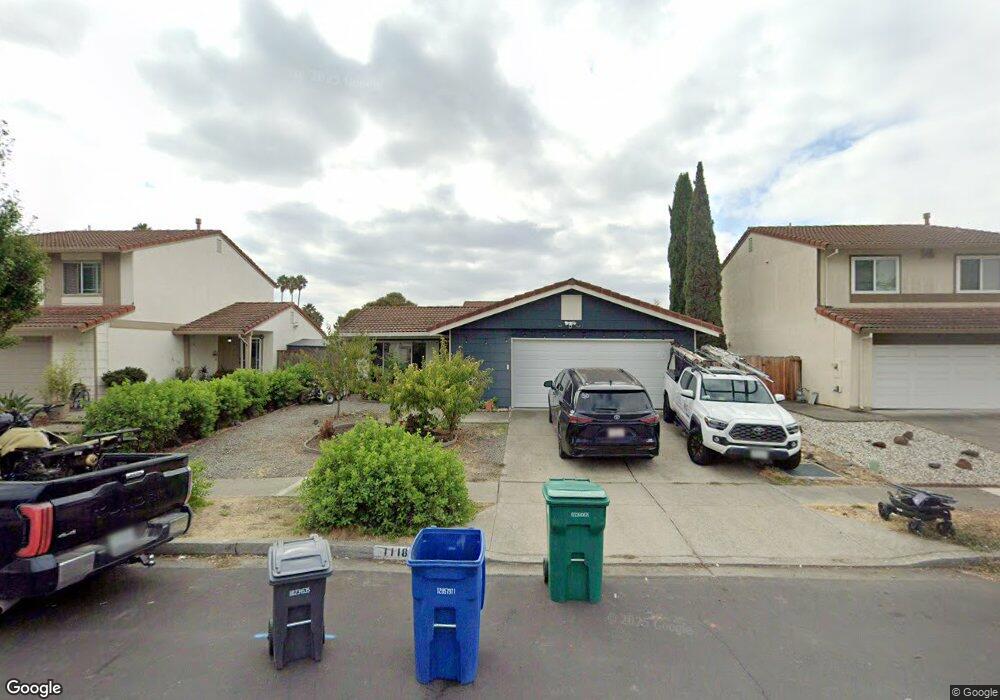
1118 Lovelock Way Hayward, CA 94544
Tennyson-Alquire NeighborhoodEstimated Value: $804,000 - $848,000
3
Beds
2
Baths
1,087
Sq Ft
$762/Sq Ft
Est. Value
About This Home
This home is located at 1118 Lovelock Way, Hayward, CA 94544 and is currently estimated at $828,399, approximately $762 per square foot. 1118 Lovelock Way is a home located in Alameda County with nearby schools including Ruus Elementary School, Cesar Chavez Middle School, and Tennyson High School.
Ownership History
Date
Name
Owned For
Owner Type
Purchase Details
Closed on
Oct 29, 2023
Sold by
Yu Jiahao and Yu Huanying
Bought by
Jiahao And Huanying Yu Family Trust and Yu
Current Estimated Value
Purchase Details
Closed on
Jul 10, 2019
Sold by
Wollman Lester P and Wollman Ava Fung
Bought by
Yu Jiahao and Yu Huanying
Home Financials for this Owner
Home Financials are based on the most recent Mortgage that was taken out on this home.
Original Mortgage
$530,000
Interest Rate
3.82%
Mortgage Type
New Conventional
Purchase Details
Closed on
Sep 26, 2008
Sold by
Salinas Esperanza
Bought by
Wollman Lester P and Wollman Ava Fung
Purchase Details
Closed on
Oct 27, 2005
Sold by
Anaya Jorge A
Bought by
Salinas Esperanza
Home Financials for this Owner
Home Financials are based on the most recent Mortgage that was taken out on this home.
Original Mortgage
$444,000
Interest Rate
7.75%
Mortgage Type
Purchase Money Mortgage
Create a Home Valuation Report for This Property
The Home Valuation Report is an in-depth analysis detailing your home's value as well as a comparison with similar homes in the area
Home Values in the Area
Average Home Value in this Area
Purchase History
| Date | Buyer | Sale Price | Title Company |
|---|---|---|---|
| Jiahao And Huanying Yu Family Trust | -- | None Listed On Document | |
| Yu Jiahao | $700,000 | Chicago Title Company | |
| Wollman Lester P | $291,000 | Chicago Title Company | |
| Salinas Esperanza | $555,000 | First American Title Co |
Source: Public Records
Mortgage History
| Date | Status | Borrower | Loan Amount |
|---|---|---|---|
| Previous Owner | Yu Jiahao | $530,000 | |
| Previous Owner | Salinas Esperanza | $444,000 |
Source: Public Records
Tax History Compared to Growth
Tax History
| Year | Tax Paid | Tax Assessment Tax Assessment Total Assessment is a certain percentage of the fair market value that is determined by local assessors to be the total taxable value of land and additions on the property. | Land | Improvement |
|---|---|---|---|---|
| 2025 | $9,183 | $758,540 | $229,662 | $535,878 |
| 2024 | $9,183 | $743,532 | $225,159 | $525,373 |
| 2023 | $9,044 | $735,818 | $220,745 | $515,073 |
| 2022 | $8,866 | $714,391 | $216,417 | $504,974 |
| 2021 | $8,793 | $700,251 | $212,175 | $495,076 |
| 2020 | $8,694 | $700,000 | $210,000 | $490,000 |
| 2019 | $4,521 | $335,918 | $100,775 | $235,143 |
| 2018 | $4,250 | $329,333 | $98,800 | $230,533 |
| 2017 | $4,155 | $322,875 | $96,862 | $226,013 |
| 2016 | $3,912 | $316,546 | $94,964 | $221,582 |
| 2015 | $3,836 | $311,794 | $93,538 | $218,256 |
| 2014 | $3,648 | $305,688 | $91,706 | $213,982 |
Source: Public Records
Map
Nearby Homes
- 1127 Hat Creek Way
- 27906 Thackeray Ave
- 918 W Tennyson Rd Unit 105
- 27949 Thornton Ct Unit 1B
- 27781 Dickens Ave
- 552 Celia St
- 878 Folsom Ave
- 27894 Andrea St
- 725 Auburn Place Unit 106
- 1352 Chelsea Way
- 1438 Salamanca Ave
- 1439 Almeria Dr
- 29043 Windemere Rd
- 1541 Ortega Ave Unit 39
- 1580 Balein Ct Unit 14
- 27923 Havana Ave
- 27505 Tampa Ave Unit 15
- 1587 de Lemos Ave
- 1400 Buckingham Way
- 29235 Lone Tree Place
- 1110 Lovelock Way
- 1126 Lovelock Way
- 1115 Gassett Ct
- 1134 Lovelock Way
- 1104 Lovelock Way
- 1123 Gassett Ct
- 1111 Gassett Ct
- 1103 Gassett Ct
- 28197 Harvey Ave
- 1119 Lovelock Way
- 1142 Lovelock Way
- 1131 Lovelock Way
- 1137 Gassett Ct
- 28232 Karn Dr
- 1150 Lovelock Way
- 1145 Lovelock Way
- 28191 Harvey Ave
- 28256 Karn Dr
- 1136 Gassett Ct
- 28188 Karn Dr