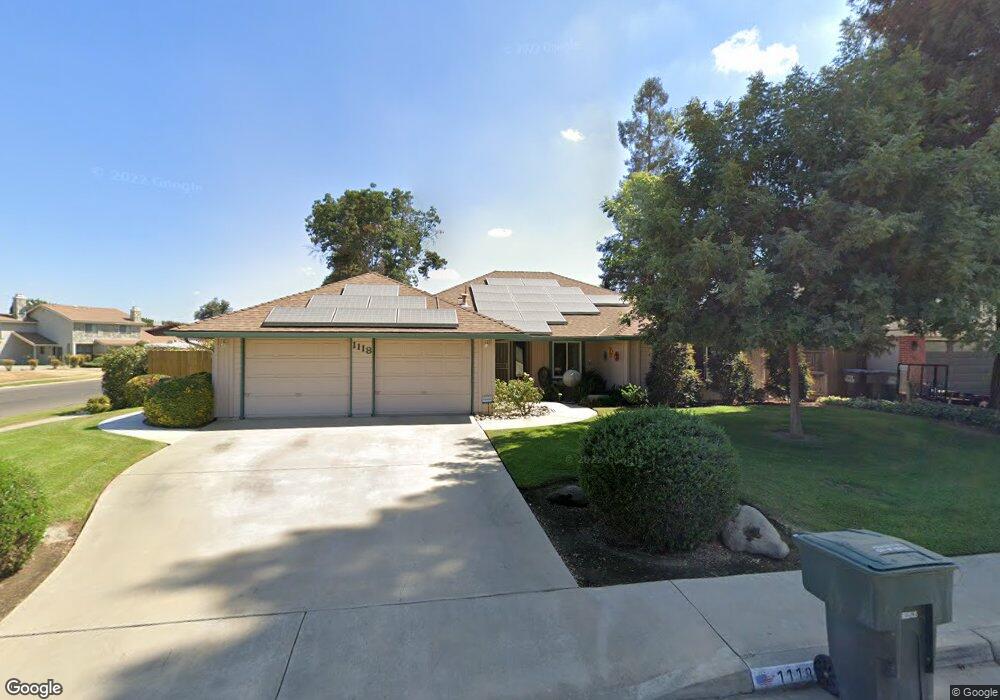
1118 N Cindy St Visalia, CA 93291
Northwest Visalia NeighborhoodEstimated Value: $412,777 - $449,000
3
Beds
2
Baths
1,908
Sq Ft
$225/Sq Ft
Est. Value
About This Home
This home is located at 1118 N Cindy St, Visalia, CA 93291 and is currently estimated at $428,444, approximately $224 per square foot. 1118 N Cindy St is a home located in Tulare County with nearby schools including Willow Glen Elementary, Green Acres Middle School, and Redwood High School.
Ownership History
Date
Name
Owned For
Owner Type
Purchase Details
Closed on
Aug 5, 2011
Sold by
Federal Home Loan Mortgage Corporation
Bought by
Smith Robert D and Turenne Florence E
Current Estimated Value
Home Financials for this Owner
Home Financials are based on the most recent Mortgage that was taken out on this home.
Original Mortgage
$137,425
Outstanding Balance
$93,720
Interest Rate
4.25%
Mortgage Type
FHA
Estimated Equity
$334,724
Purchase Details
Closed on
Aug 19, 2010
Sold by
Norman Robert P
Bought by
Federal Home Mortgage Loan Corporation
Purchase Details
Closed on
Jan 27, 1998
Sold by
Waggoner George W
Bought by
Norman Robert P and Norman Karen
Home Financials for this Owner
Home Financials are based on the most recent Mortgage that was taken out on this home.
Original Mortgage
$140,600
Interest Rate
6.99%
Purchase Details
Closed on
Jul 27, 1993
Sold by
Gile Richard A
Bought by
Waggoner George W and Waggoner Judy A
Home Financials for this Owner
Home Financials are based on the most recent Mortgage that was taken out on this home.
Original Mortgage
$126,800
Interest Rate
7.2%
Create a Home Valuation Report for This Property
The Home Valuation Report is an in-depth analysis detailing your home's value as well as a comparison with similar homes in the area
Home Values in the Area
Average Home Value in this Area
Purchase History
| Date | Buyer | Sale Price | Title Company |
|---|---|---|---|
| Smith Robert D | $141,000 | First American Title Ins Co | |
| Federal Home Mortgage Loan Corporation | $134,400 | Accommodation | |
| Norman Robert P | $148,000 | Fidelity National Title Co | |
| Waggoner George W | $158,500 | First American Title Ins Co |
Source: Public Records
Mortgage History
| Date | Status | Borrower | Loan Amount |
|---|---|---|---|
| Open | Smith Robert D | $137,425 | |
| Previous Owner | Norman Robert P | $140,600 | |
| Previous Owner | Waggoner George W | $126,800 |
Source: Public Records
Tax History Compared to Growth
Tax History
| Year | Tax Paid | Tax Assessment Tax Assessment Total Assessment is a certain percentage of the fair market value that is determined by local assessors to be the total taxable value of land and additions on the property. | Land | Improvement |
|---|---|---|---|---|
| 2025 | $1,871 | $177,102 | $62,802 | $114,300 |
| 2024 | $1,871 | $173,630 | $61,571 | $112,059 |
| 2023 | $1,820 | $170,226 | $60,364 | $109,862 |
| 2022 | $1,739 | $166,889 | $59,181 | $107,708 |
| 2021 | $1,741 | $163,617 | $58,021 | $105,596 |
| 2020 | $1,724 | $161,939 | $57,426 | $104,513 |
| 2019 | $1,677 | $158,764 | $56,300 | $102,464 |
| 2018 | $1,633 | $155,651 | $55,196 | $100,455 |
| 2017 | $1,618 | $152,599 | $54,114 | $98,485 |
| 2016 | $1,586 | $149,607 | $53,053 | $96,554 |
| 2015 | $1,540 | $147,360 | $52,256 | $95,104 |
| 2014 | $1,540 | $144,473 | $51,232 | $93,241 |
Source: Public Records
Map
Nearby Homes
- 1214 N Julieann Ct
- 1126 N Linwood St
- 3900 W Allen Ct
- 145 E Taylor Ave
- 3438 N Oakwood Ct
- 3414 N Oakwood St
- 3432 N Atwood Ct
- 3728 W Nicholas Ave
- 4140 W School Ave
- 4702 W Harold Ave
- 4106 W Prospect Ave
- 1007 N Atwood St
- 3633 W Harold Ave
- 350 N Crenshaw St
- 3842 W Buena Vista Ave
- 1615 N Volterra Ct
- 3530 W Harold Ave
- 3833 W Vine Ave
- 3727 W Mill Creek Dr
- 4112 W Clinton Ct
- 1104 N Cindy St
- 1049 N Rono St
- 1045 N Rono St
- 4401 W Douglas Ave
- 1040 N Cindy St
- 4322 W Douglas Ave
- 4312 W Douglas Ave
- 1035 N Rono St
- 4300 W Douglas Ave
- 0 W Douglas Ave
- 4340 W Douglas Ave
- 1041 N Cindy St
- 1026 N Cindy St
- 1025 N Rono St
- 1126 N Bollinger St
- 1112 N Bollinger St
- 1029 N Cindy St
- 4242 W Douglas Ave
- 1100 N Bollinger St
- 1016 N Cindy St