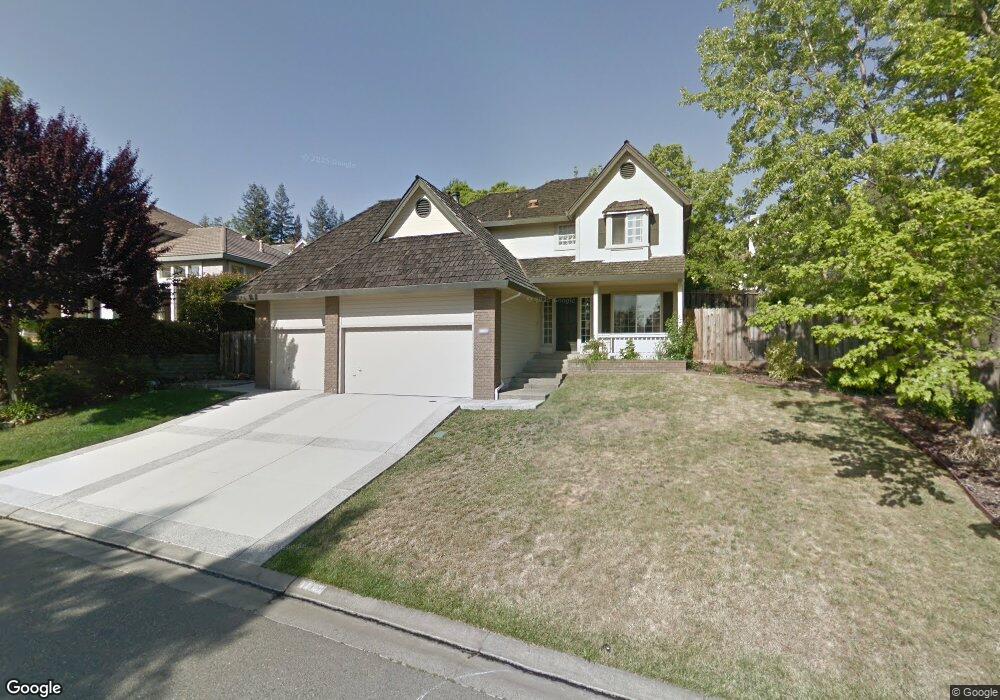
1118 Turquoise Way El Dorado Hills, CA 95762
Ridgeview Village NeighborhoodEstimated Value: $683,429 - $770,000
4
Beds
3
Baths
1,877
Sq Ft
$387/Sq Ft
Est. Value
About This Home
This home is located at 1118 Turquoise Way, El Dorado Hills, CA 95762 and is currently estimated at $725,857, approximately $386 per square foot. 1118 Turquoise Way is a home located in El Dorado County with nearby schools including Silva Valley Elementary School, Rolling Hills Middle School, and Oak Ridge High School.
Ownership History
Date
Name
Owned For
Owner Type
Purchase Details
Closed on
Jun 11, 2019
Sold by
Peirce Jay and Peirce Ondine
Bought by
Peirce Jay and Peirce Ondine
Current Estimated Value
Purchase Details
Closed on
Feb 15, 2001
Sold by
Christensen Mark J and Christensen Kathleen G
Bought by
Peirce Jay and Peirce Ondine
Home Financials for this Owner
Home Financials are based on the most recent Mortgage that was taken out on this home.
Original Mortgage
$200,000
Outstanding Balance
$71,215
Interest Rate
6.89%
Estimated Equity
$654,642
Purchase Details
Closed on
Mar 16, 1994
Sold by
Marx Bruce
Bought by
Christensen Mark J and Christensen Kathleen G
Home Financials for this Owner
Home Financials are based on the most recent Mortgage that was taken out on this home.
Original Mortgage
$154,400
Interest Rate
7%
Create a Home Valuation Report for This Property
The Home Valuation Report is an in-depth analysis detailing your home's value as well as a comparison with similar homes in the area
Home Values in the Area
Average Home Value in this Area
Purchase History
| Date | Buyer | Sale Price | Title Company |
|---|---|---|---|
| Peirce Jay | -- | None Available | |
| Peirce Jay | $295,000 | First American Title Ins Co | |
| Christensen Mark J | $193,000 | Fidelity National Title |
Source: Public Records
Mortgage History
| Date | Status | Borrower | Loan Amount |
|---|---|---|---|
| Open | Peirce Jay | $200,000 | |
| Previous Owner | Christensen Mark J | $154,400 |
Source: Public Records
Tax History Compared to Growth
Tax History
| Year | Tax Paid | Tax Assessment Tax Assessment Total Assessment is a certain percentage of the fair market value that is determined by local assessors to be the total taxable value of land and additions on the property. | Land | Improvement |
|---|---|---|---|---|
| 2025 | $4,623 | $444,491 | $173,273 | $271,218 |
| 2024 | $4,623 | $435,776 | $169,876 | $265,900 |
| 2023 | $4,507 | $427,233 | $166,546 | $260,687 |
| 2022 | $4,468 | $418,857 | $163,281 | $255,576 |
| 2021 | $4,406 | $410,645 | $160,080 | $250,565 |
| 2020 | $4,348 | $406,435 | $158,439 | $247,996 |
| 2019 | $4,280 | $398,467 | $155,333 | $243,134 |
| 2018 | $4,134 | $390,655 | $152,288 | $238,367 |
| 2017 | $4,061 | $382,996 | $149,302 | $233,694 |
| 2016 | $4,024 | $375,487 | $146,375 | $229,112 |
| 2015 | $3,918 | $369,848 | $144,177 | $225,671 |
| 2014 | $3,918 | $362,604 | $141,353 | $221,251 |
Source: Public Records
Map
Nearby Homes
- 3058 Ridgeview Dr
- 3789 Pardee Ct
- 3178 Ridgeview Dr
- 1999 Shelby Cir
- 265 Muse Dr
- 47 Powers Dr
- LOT 2 Julie Ann Way
- 2595 Capetanios Dr
- 2581 Capetanios Dr
- 0 Capetanios Dr Unit 222109547
- 3197 Warren Ln
- Plan 2 at Ridgeview
- 3226 Beatty Dr
- 3452 Tah Nee Way
- 2757 Capetanios Dr
- 3280 Beatty Dr
- 5128 Wild Oak Ln
- 424 Powers Dr
- 436 Powers Dr
- 3040 Vista Lefonti
- 1112 Turquoise Way
- 1126 Turquoise Way
- 2025 Moonstone Cir
- 2033 Moonstone Cir
- 1130 Turquoise Way
- 1117 Turquoise Way
- 2017 Moonstone Cir
- 1106 Turquoise Way
- 1125 Turquoise Way
- 2041 Moonstone Cir
- 3007 Ridgeview Dr
- 1107 Turquoise Way
- 1131 Turquoise Way
- 1136 Turquoise Way
- 2005 Moonstone Cir
- 2981 Ridgeview Dr
- 1137 Turquoise Way
- 2049 Moonstone Cir
- 2028 Moonstone Cir
- 2975 Ridgeview Dr