Estimated Value: $319,000 - $382,000
4
Beds
2
Baths
1,455
Sq Ft
$241/Sq Ft
Est. Value
About This Home
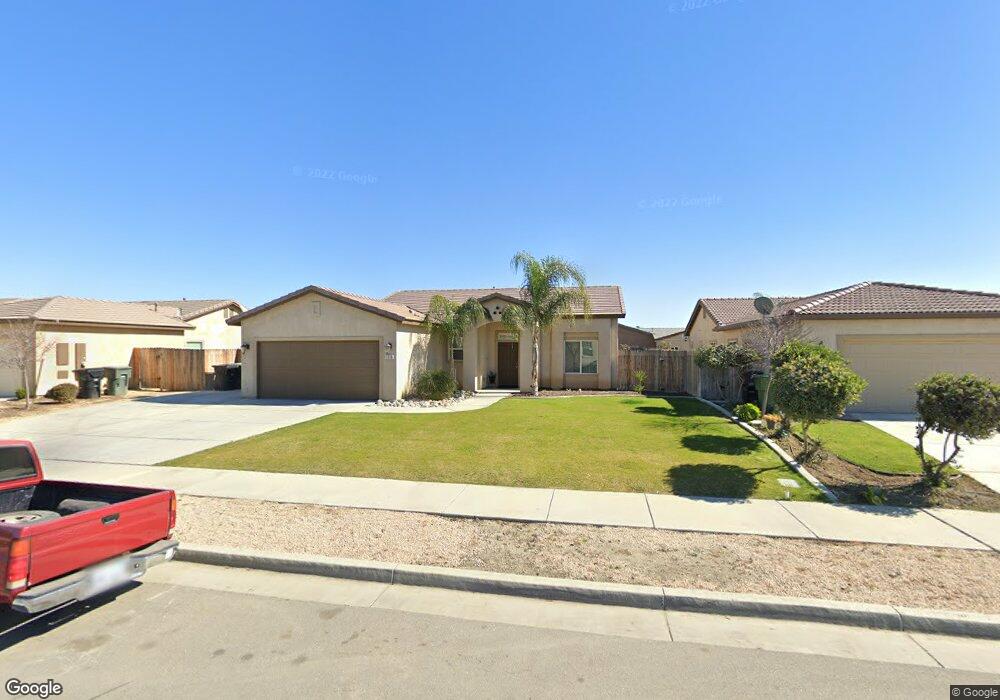
This home is located at 1118 Via Athens Blvd, Wasco, CA 93280 and is currently estimated at $350,570, approximately $240 per square foot. 1118 Via Athens Blvd is a home with nearby schools including John L. Prueitt Elementary School, Thomas Jefferson Middle School, and Wasco High School.
Ownership History
Date
Name
Owned For
Owner Type
Purchase Details
Closed on
May 25, 2016
Sold by
Higher Grounds Solutions Inc
Bought by
Ayala Torres Maria
Current Estimated Value
Home Financials for this Owner
Home Financials are based on the most recent Mortgage that was taken out on this home.
Original Mortgage
$205,450
Interest Rate
3.45%
Mortgage Type
USDA
Purchase Details
Closed on
Oct 8, 2015
Sold by
Wasco Action Properties Llc
Bought by
Higher Grounds Solutions Inc
Home Financials for this Owner
Home Financials are based on the most recent Mortgage that was taken out on this home.
Original Mortgage
$2,356,800
Interest Rate
3.87%
Mortgage Type
Purchase Money Mortgage
Purchase Details
Closed on
Jun 19, 2014
Sold by
Saticoy Development Company Llc
Bought by
Wasco Action Properties Llc
Create a Home Valuation Report for This Property
The Home Valuation Report is an in-depth analysis detailing your home's value as well as a comparison with similar homes in the area
Home Values in the Area
Average Home Value in this Area
Purchase History
| Date | Buyer | Sale Price | Title Company |
|---|---|---|---|
| Ayala Torres Maria | $205,500 | Ticor Title Company | |
| Higher Grounds Solutions Inc | $1,102,500 | Ticor Title Company | |
| Wasco Action Properties Llc | -- | None Available |
Source: Public Records
Mortgage History
| Date | Status | Borrower | Loan Amount |
|---|---|---|---|
| Previous Owner | Ayala Torres Maria | $205,450 | |
| Previous Owner | Higher Grounds Solutions Inc | $2,356,800 |
Source: Public Records
Tax History Compared to Growth
Tax History
| Year | Tax Paid | Tax Assessment Tax Assessment Total Assessment is a certain percentage of the fair market value that is determined by local assessors to be the total taxable value of land and additions on the property. | Land | Improvement |
|---|---|---|---|---|
| 2025 | $3,111 | $238,493 | $46,420 | $192,073 |
| 2024 | $3,021 | $233,817 | $45,510 | $188,307 |
| 2023 | $3,021 | $229,233 | $44,618 | $184,615 |
| 2022 | $2,927 | $224,740 | $43,744 | $180,996 |
| 2021 | $2,928 | $220,335 | $42,887 | $177,448 |
| 2020 | $2,747 | $218,077 | $42,448 | $175,629 |
| 2019 | $2,730 | $218,077 | $42,448 | $175,629 |
| 2018 | $2,732 | $209,610 | $40,800 | $168,810 |
| 2017 | $2,715 | $205,500 | $40,000 | $165,500 |
| 2016 | $663 | $37,500 | $37,500 | $0 |
| 2015 | $292 | $16,393 | $16,393 | $0 |
| 2014 | $401 | $16,072 | $16,072 | $0 |
Source: Public Records
Map
Nearby Homes
- 0 Central Unit 202502202
- 0 Central Unit 202502095
- 2700 7th St
- 901 Cabernet Dr
- 2216 9th St
- 1440 Aspen Ave
- 1701 San Jose Ave
- 1921 Cherrytree Way
- 1812 San Jose Ave
- 1750 Bay Meadows Dr
- 1917 3rd St
- 1832 4th St
- 1026 Birch Ave
- 625 Cedar Ave
- 0 Laredo St Unit 202508732
- 0 Laredo St Unit 202508731
- 1622 6th St
- 1034 Oak Ave
- 916 Oak Ave
- 1509 5th St
- 1114 Via Athens Blvd
- 1122 Via Athens Blvd
- 2506 Via Morocco Blvd
- 1110 Via Athens Blvd
- 2623 Via Serrantino Ct
- 1117 Via Athens Blvd
- 1113 Via Athens Blvd
- 1121 Via Athens Blvd
- 2617 Via Serrantino Ct
- 2502 Via Morocco Blvd
- 1017 Via Vargas Blvd
- 2601 Via Morocco Blvd
- 2605 Via Morocco Blvd
- 1109 Via Athens Blvd
- 2613 Via Serrantino Ct
- 2609 Via Morocco Blvd
- 1012 Via Vargas Blvd
- 2613 Via Morocco Blvd
- 1021 Via Vargas Blvd
- 2626 Via Serrantino Ct