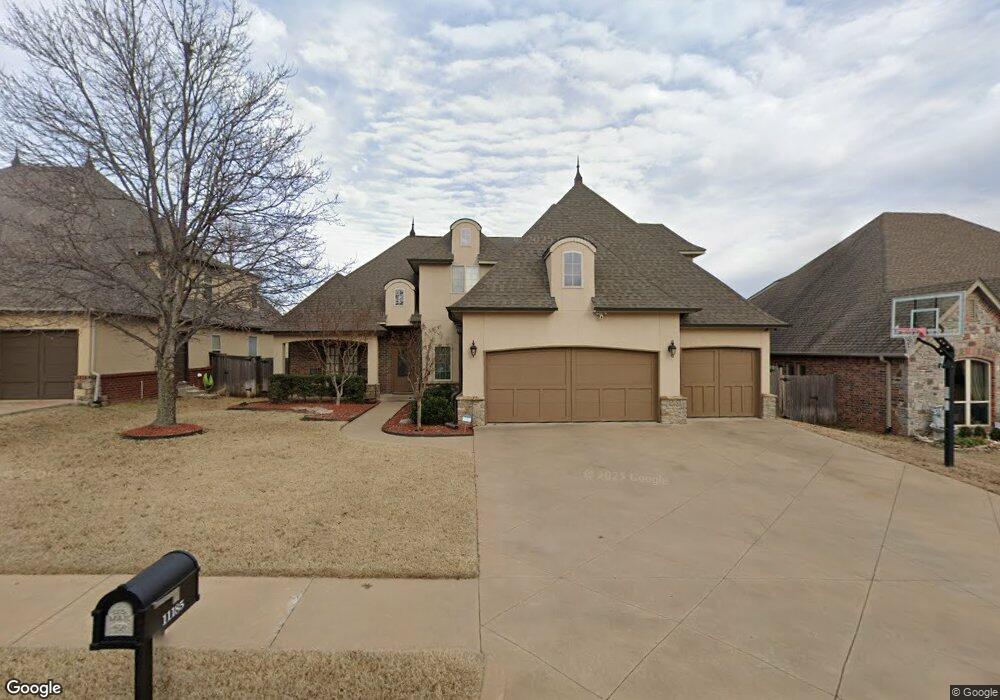
11185 S 73rd East Ave Bixby, OK 74008
North Bixby NeighborhoodEstimated Value: $491,230 - $589,000
4
Beds
3
Baths
3,245
Sq Ft
$164/Sq Ft
Est. Value
About This Home
This home is located at 11185 S 73rd East Ave, Bixby, OK 74008 and is currently estimated at $531,058, approximately $163 per square foot. 11185 S 73rd East Ave is a home located in Tulsa County with nearby schools including Bixby North Elementary, Bixby North Intermediate, and Bixby Middle School.
Ownership History
Date
Name
Owned For
Owner Type
Purchase Details
Closed on
Aug 2, 2021
Sold by
Anthony Erik G and Anthony Kerri D
Bought by
Tfd Trust and Anthony
Current Estimated Value
Purchase Details
Closed on
Jul 22, 2021
Sold by
Anthony Erik G and Anthony Kerri D
Bought by
Anthony Erik Gerard and Anthony Kerri Dione
Purchase Details
Closed on
Jun 2, 2011
Sold by
Wallace Mellyn D
Bought by
Anthony Kerri D
Purchase Details
Closed on
Oct 26, 2007
Sold by
Shale Ridge Homes Inc
Bought by
Wallace Mellyn D
Home Financials for this Owner
Home Financials are based on the most recent Mortgage that was taken out on this home.
Original Mortgage
$146,500
Interest Rate
6.37%
Mortgage Type
Purchase Money Mortgage
Purchase Details
Closed on
Jan 19, 2006
Sold by
81St & Memorial Llc
Bought by
Shale Ridge Homes Inc
Home Financials for this Owner
Home Financials are based on the most recent Mortgage that was taken out on this home.
Original Mortgage
$296,800
Interest Rate
6.25%
Mortgage Type
Construction
Create a Home Valuation Report for This Property
The Home Valuation Report is an in-depth analysis detailing your home's value as well as a comparison with similar homes in the area
Home Values in the Area
Average Home Value in this Area
Purchase History
| Date | Buyer | Sale Price | Title Company |
|---|---|---|---|
| Tfd Trust | -- | None Listed On Document | |
| Anthony Erik Gerard | -- | None Available | |
| Anthony Kerri D | $340,000 | Frisco Title Corporation | |
| Wallace Mellyn D | $346,500 | None Available | |
| Shale Ridge Homes Inc | $69,000 | None Available |
Source: Public Records
Mortgage History
| Date | Status | Borrower | Loan Amount |
|---|---|---|---|
| Previous Owner | Wallace Mellyn D | $146,500 | |
| Previous Owner | Shale Ridge Homes Inc | $296,800 |
Source: Public Records
Tax History Compared to Growth
Tax History
| Year | Tax Paid | Tax Assessment Tax Assessment Total Assessment is a certain percentage of the fair market value that is determined by local assessors to be the total taxable value of land and additions on the property. | Land | Improvement |
|---|---|---|---|---|
| 2024 | $5,768 | $43,295 | $7,289 | $36,006 |
| 2023 | $5,768 | $41,233 | $7,105 | $34,128 |
| 2022 | $5,518 | $39,271 | $7,970 | $31,301 |
| 2021 | $4,912 | $37,400 | $7,590 | $29,810 |
| 2020 | $4,943 | $37,400 | $7,590 | $29,810 |
| 2019 | $4,961 | $37,400 | $7,590 | $29,810 |
| 2018 | $4,915 | $37,400 | $7,590 | $29,810 |
| 2017 | $4,884 | $37,400 | $7,590 | $29,810 |
| 2016 | $4,825 | $37,400 | $7,590 | $29,810 |
| 2015 | $4,614 | $37,400 | $7,590 | $29,810 |
| 2014 | $4,607 | $37,400 | $7,590 | $29,810 |
Source: Public Records
Map
Nearby Homes
- 11175 S 73rd East Ave
- 11201 S 74th East Ave
- 11259 S 72nd Ct E
- 11248 S 75th Ave E
- 11285 S 73rd East Place
- 7226 E 111th Place S
- 11280 S 72nd East Ct
- 7207 E 112th Place S
- 8986 E 161st Place S
- 15622 75th East Ave
- 11170 S 72nd East Ave
- 11190 S 72nd East Ave
- 11220 S 72nd East Ave
- 10905 S 77th East Place
- 7415 E 109th St
- 10910 S 69th East Ave
- 11401 S 67th East Ave
- 6805 E 115th Place S
- 6709 E 109th St S
- 6619 E 109th St
- 11175 S 73rd Ave E
- 11205 S 73rd East Ave
- 7317 E 112th St S
- 11215 S 73rd East Ave
- 11165 S 73rd East Ave
- 7318 E 112th St S
- 7293 E 112th St S
- 7325 E 112th St S
- 11225 S 73rd Ave E
- 7292 E 112th St S
- 11225 S 73rd East Ave
- 11155 S 73rd East Ave
- 7316 E 111th Place S
- 7326 E 112th St S
- 7285 E 112th St S
- 7328 E 111th Place S
- 7298 E 111th Place S
- 7337 E 112th St S
- 7286 E 112th St S
- 7315 E 112th Place S