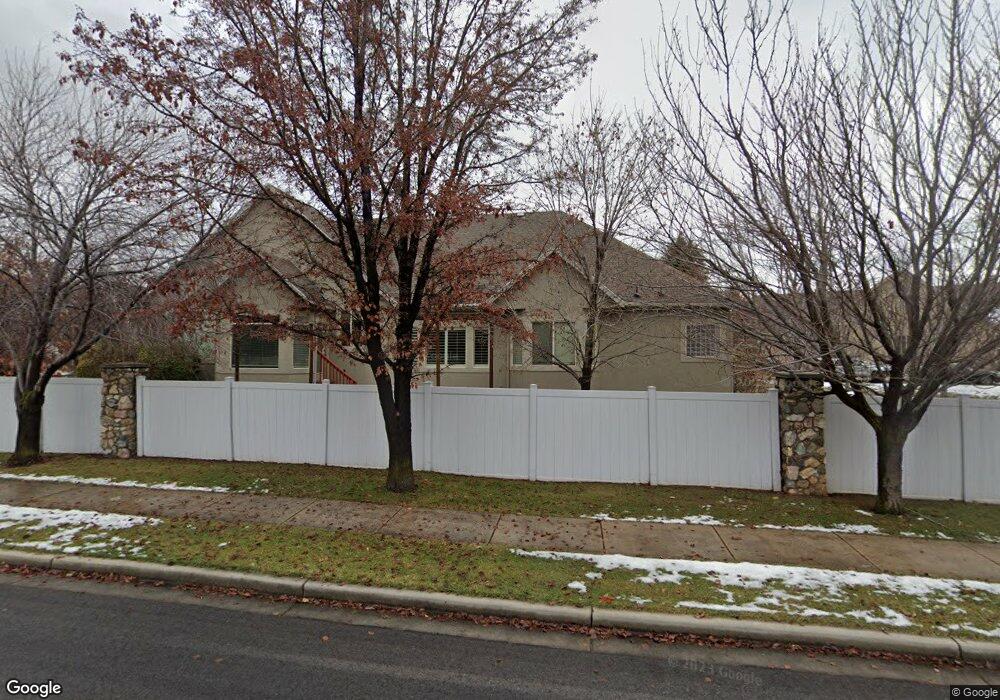
11188 N Avonmore Ct Highland, UT 84003
Estimated Value: $1,058,000 - $1,262,256
6
Beds
5
Baths
4,620
Sq Ft
$250/Sq Ft
Est. Value
About This Home
This home is located at 11188 N Avonmore Ct, Highland, UT 84003 and is currently estimated at $1,154,564, approximately $249 per square foot. 11188 N Avonmore Ct is a home located in Utah County with nearby schools including Westfield School, Timberline Middle School, and Lone Peak High School.
Ownership History
Date
Name
Owned For
Owner Type
Purchase Details
Closed on
Aug 15, 2007
Sold by
Evans Shane G and Evans Emily T
Bought by
Hawkins Joseph Jackson
Current Estimated Value
Home Financials for this Owner
Home Financials are based on the most recent Mortgage that was taken out on this home.
Original Mortgage
$22,520
Interest Rate
6.74%
Mortgage Type
Purchase Money Mortgage
Purchase Details
Closed on
Jun 7, 2007
Sold by
Sammis Norman and Sammis Eileen
Bought by
Evans Shane G and Evans Emily T
Purchase Details
Closed on
Sep 7, 2005
Sold by
Evans Shane G
Bought by
Evans Shane G and Evans Emily T
Home Financials for this Owner
Home Financials are based on the most recent Mortgage that was taken out on this home.
Original Mortgage
$356,000
Interest Rate
2%
Mortgage Type
New Conventional
Create a Home Valuation Report for This Property
The Home Valuation Report is an in-depth analysis detailing your home's value as well as a comparison with similar homes in the area
Home Values in the Area
Average Home Value in this Area
Purchase History
| Date | Buyer | Sale Price | Title Company |
|---|---|---|---|
| Hawkins Joseph Jackson | -- | Select Title Insurance Agen | |
| Evans Shane G | -- | Select Title Insurance Agen | |
| Evans Shane G | -- | Provo Land Title Co |
Source: Public Records
Mortgage History
| Date | Status | Borrower | Loan Amount |
|---|---|---|---|
| Closed | Hawkins Joseph Jackson | $22,520 | |
| Previous Owner | Evans Shane G | $356,000 |
Source: Public Records
Tax History Compared to Growth
Tax History
| Year | Tax Paid | Tax Assessment Tax Assessment Total Assessment is a certain percentage of the fair market value that is determined by local assessors to be the total taxable value of land and additions on the property. | Land | Improvement |
|---|---|---|---|---|
| 2025 | $8,433 | $1,104,000 | $654,400 | $449,600 |
| 2024 | $8,433 | $1,041,600 | $0 | $0 |
| 2023 | $7,767 | $1,034,900 | $0 | $0 |
| 2022 | $7,872 | $1,017,000 | $593,800 | $423,200 |
| 2021 | $3,419 | $658,000 | $329,900 | $328,100 |
| 2020 | $3,208 | $605,400 | $286,900 | $318,500 |
| 2019 | $2,896 | $571,700 | $253,200 | $318,500 |
| 2018 | $2,870 | $538,500 | $253,200 | $285,300 |
| 2017 | $2,637 | $264,110 | $0 | $0 |
| 2016 | $2,959 | $276,980 | $0 | $0 |
| 2015 | $2,689 | $238,590 | $0 | $0 |
| 2014 | $2,608 | $229,295 | $0 | $0 |
Source: Public Records
Map
Nearby Homes
- 11124 N 6000 W
- 5798 W 11350 N
- 11248 Hawkstone Way Unit 109
- 6024 Hawkstone Way Unit 108
- 11228 Hawkstone Way Unit 110
- 5983 W 11270 N Unit 4
- 5976 W 11270 N Unit 5
- 10818 N 6000 W
- 5538 W Turin Ln
- 5538 W Naples Dr Unit 125
- 10925 N Marsala Dr
- 5509 W Sicily Ln
- 10905 N Vercelli Dr
- 6271 W 10830 St N
- 5377 W Evergreen Way
- 5984 W 11200 N Unit 1
- 10763 N Dosh Ln
- Villa A Plan at TEN700
- Villa D Plan at TEN700
- Cottonwood Villa Plan at TEN700
- 11188 N Avonmore Ct Unit 17
- 11188 N Avonmore Ct
- 11188 N Avonmore Ct Unit 17
- 11181 N Avonmore Ct Unit 18
- 5862 W 11200 N
- 5862 W 11200 N Unit 8
- 11168 N Avonmore Ct
- 11168 N Avonmore Ct Unit 16
- 11168 N Avonmore Ct Unit 15
- 5834 W 11200 N
- 5834 W 11200 N Unit 9
- 5870 Avonmore Ct Unit 19
- 5420 W 11250 St N
- 5421 W 11250 St N
- 5462 W 11250 St N
- 11181 N 5870 W
- 5882 W 11200 N
- 5882 W 11200 N Unit 7
- 11148 Avonmore Ct
- 11124 N Avonmore Ct Unit 9