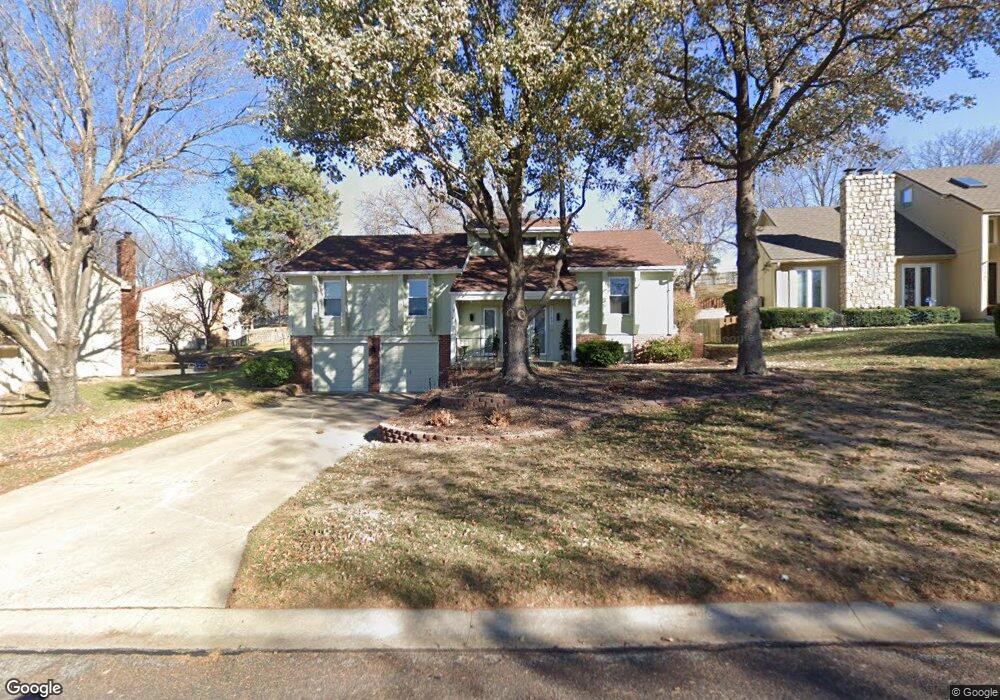
11189 Benson St Overland Park, KS 66210
Central Overland Park NeighborhoodEstimated Value: $438,000 - $475,000
4
Beds
3
Baths
1,694
Sq Ft
$264/Sq Ft
Est. Value
About This Home
This home is located at 11189 Benson St, Overland Park, KS 66210 and is currently estimated at $447,956, approximately $264 per square foot. 11189 Benson St is a home located in Johnson County with nearby schools including Indian Valley Elementary School, Oxford Middle, and Blue Valley Northwest High School.
Ownership History
Date
Name
Owned For
Owner Type
Purchase Details
Closed on
Mar 7, 2018
Sold by
Szippl Timoty J
Bought by
Szippl Timothy J and Szippl Susanne A
Current Estimated Value
Purchase Details
Closed on
Oct 8, 2010
Sold by
Szippl Timothy J and Szippl Christine A
Bought by
Szippl Timothy J
Home Financials for this Owner
Home Financials are based on the most recent Mortgage that was taken out on this home.
Original Mortgage
$206,250
Interest Rate
4.39%
Mortgage Type
VA
Purchase Details
Closed on
Aug 22, 2005
Sold by
Cole Patricia A
Bought by
Szippl Timothy J and Szippl Christine A
Home Financials for this Owner
Home Financials are based on the most recent Mortgage that was taken out on this home.
Original Mortgage
$227,200
Interest Rate
5.78%
Mortgage Type
VA
Create a Home Valuation Report for This Property
The Home Valuation Report is an in-depth analysis detailing your home's value as well as a comparison with similar homes in the area
Home Values in the Area
Average Home Value in this Area
Purchase History
| Date | Buyer | Sale Price | Title Company |
|---|---|---|---|
| Szippl Timothy J | -- | None Available | |
| Szippl Timothy J | -- | None Available | |
| Szippl Timothy J | -- | Kansas City Title |
Source: Public Records
Mortgage History
| Date | Status | Borrower | Loan Amount |
|---|---|---|---|
| Previous Owner | Szippl Timothy J | $206,250 | |
| Previous Owner | Szippl Timothy J | $227,200 |
Source: Public Records
Tax History Compared to Growth
Tax History
| Year | Tax Paid | Tax Assessment Tax Assessment Total Assessment is a certain percentage of the fair market value that is determined by local assessors to be the total taxable value of land and additions on the property. | Land | Improvement |
|---|---|---|---|---|
| 2024 | $4,635 | $45,505 | $11,416 | $34,089 |
| 2023 | $4,561 | $43,895 | $11,416 | $32,479 |
| 2022 | $4,023 | $38,065 | $11,416 | $26,649 |
| 2021 | $4,023 | $36,029 | $9,921 | $26,108 |
| 2020 | $4,047 | $36,006 | $8,627 | $27,379 |
| 2019 | $3,862 | $33,637 | $5,751 | $27,886 |
| 2018 | $3,733 | $31,866 | $5,751 | $26,115 |
| 2017 | $3,517 | $29,509 | $5,751 | $23,758 |
| 2016 | $3,338 | $27,991 | $5,751 | $22,240 |
| 2015 | $3,223 | $26,933 | $5,751 | $21,182 |
| 2013 | -- | $25,024 | $5,751 | $19,273 |
Source: Public Records
Map
Nearby Homes
- 11163 Eby St
- 8712 W 113th St
- 8500 W 113th St
- 9108 W 113th St
- 11404 Grandview Dr
- 9013 W 115th St
- 8635 W 109th St
- 11316 Hemlock St
- 8607 W 108 Place
- 11447 Craig St
- 8819 W 106th Terrace
- 8858 W 106th Terrace
- 8028 W 116th St
- 11504 Newton St
- 11721 Craig St
- 11309 Riley St
- 11838 Mackey St
- 9417 W 120th St
- 8726 W 104th St
- 11920 Grandview St
- 11195 Benson St
- 11181 Benson St
- 11169 Benson St
- 11201 Benson St
- 11188 Benson St
- 11192 Benson St
- 11180 Benson St
- 11207 Benson St
- 11200 Benson St
- 11163 Benson St
- 11172 Benson St
- 11211 Benson St
- 11210 Benson St
- 11164 Benson St
- 11157 Benson St
- 11151 Benson St
- 11193 Eby St
- 11201 Eby St
- 11185 Eby St
- 11209 Eby St