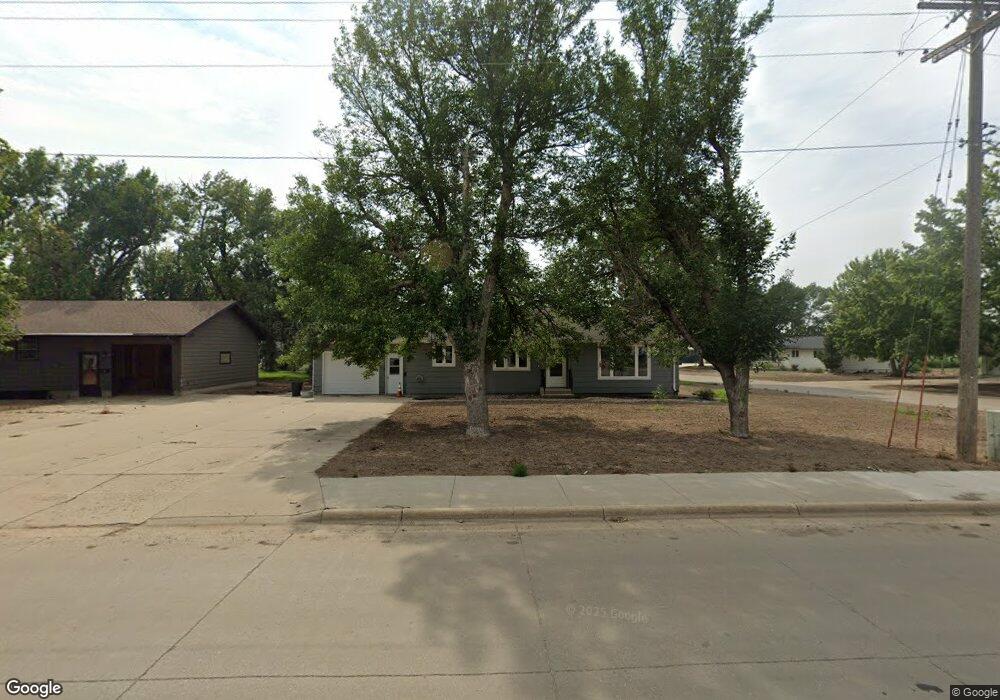
1119 10th Ave Rock Valley, IA 51247
Estimated Value: $159,000 - $227,000
--
Bed
1
Bath
1,218
Sq Ft
$161/Sq Ft
Est. Value
About This Home
This home is located at 1119 10th Ave, Rock Valley, IA 51247 and is currently estimated at $196,253, approximately $161 per square foot. 1119 10th Ave is a home located in Sioux County with nearby schools including Rock Valley Elementary School, Rock Valley Middle School, and Rock Valley Junior/Senior High School.
Ownership History
Date
Name
Owned For
Owner Type
Purchase Details
Closed on
Jul 24, 2019
Sold by
Van-Kekerix Ross and Van-Kekerix Marissa A
Bought by
Vankekerix Ross A and Vankekerix Marissa A
Current Estimated Value
Purchase Details
Closed on
Feb 27, 2009
Sold by
Ranschau Neil J
Bought by
Vanvankekerix Ross Van
Home Financials for this Owner
Home Financials are based on the most recent Mortgage that was taken out on this home.
Original Mortgage
$94,300
Interest Rate
4.91%
Mortgage Type
New Conventional
Purchase Details
Closed on
Dec 23, 2005
Sold by
Hoogendoorn Judy K
Bought by
Ranschau Neil J
Home Financials for this Owner
Home Financials are based on the most recent Mortgage that was taken out on this home.
Original Mortgage
$66,400
Interest Rate
6.48%
Mortgage Type
FHA
Create a Home Valuation Report for This Property
The Home Valuation Report is an in-depth analysis detailing your home's value as well as a comparison with similar homes in the area
Home Values in the Area
Average Home Value in this Area
Purchase History
| Date | Buyer | Sale Price | Title Company |
|---|---|---|---|
| Vankekerix Ross A | -- | -- | |
| Vanvankekerix Ross Van | $91,000 | None Available | |
| Ranschau Neil J | $83,000 | None Available |
Source: Public Records
Mortgage History
| Date | Status | Borrower | Loan Amount |
|---|---|---|---|
| Previous Owner | Vanvankekerix Ross Van | $94,300 | |
| Previous Owner | Ranschau Neil J | $66,400 |
Source: Public Records
Tax History Compared to Growth
Tax History
| Year | Tax Paid | Tax Assessment Tax Assessment Total Assessment is a certain percentage of the fair market value that is determined by local assessors to be the total taxable value of land and additions on the property. | Land | Improvement |
|---|---|---|---|---|
| 2025 | $2,380 | $24,580 | $22,600 | $1,980 |
| 2024 | $2,380 | $153,750 | $22,600 | $131,150 |
| 2023 | $2,324 | $153,750 | $22,600 | $131,150 |
| 2022 | $2,006 | $119,530 | $22,600 | $96,930 |
| 2021 | $2,136 | $119,860 | $22,600 | $97,260 |
| 2020 | $2,136 | $114,350 | $22,600 | $91,750 |
| 2019 | $1,988 | $103,880 | $14,380 | $89,500 |
| 2018 | $1,950 | $103,880 | $14,380 | $89,500 |
| 2017 | $1,950 | $103,880 | $14,380 | $89,500 |
| 2014 | $1,676 | $88,530 | $0 | $0 |
Source: Public Records
Map
Nearby Homes