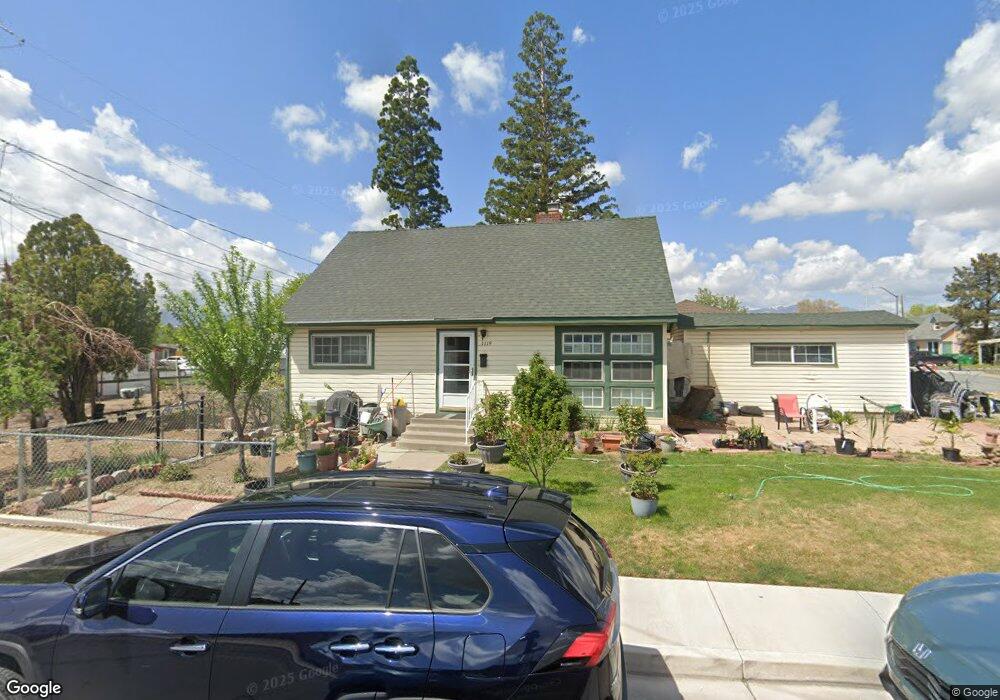
1119 19th St Sparks, NV 89431
Downtown Sparks NeighborhoodEstimated Value: $386,257 - $423,000
4
Beds
1
Bath
1,287
Sq Ft
$314/Sq Ft
Est. Value
About This Home
This home is located at 1119 19th St, Sparks, NV 89431 and is currently estimated at $404,564, approximately $314 per square foot. 1119 19th St is a home located in Washoe County with nearby schools including Kate M Smith Elementary School, Sparks Middle School, and Sparks High School.
Ownership History
Date
Name
Owned For
Owner Type
Purchase Details
Closed on
Feb 20, 1997
Sold by
Myer Fred and Myer Victoria
Bought by
Ibarra Hector M and Ibarra Maria T
Current Estimated Value
Home Financials for this Owner
Home Financials are based on the most recent Mortgage that was taken out on this home.
Original Mortgage
$111,176
Outstanding Balance
$11,454
Interest Rate
7.85%
Mortgage Type
FHA
Estimated Equity
$393,110
Purchase Details
Closed on
Feb 16, 1994
Sold by
Myer Fred R
Bought by
Myer Fred
Home Financials for this Owner
Home Financials are based on the most recent Mortgage that was taken out on this home.
Original Mortgage
$52,419
Interest Rate
6.98%
Mortgage Type
FHA
Create a Home Valuation Report for This Property
The Home Valuation Report is an in-depth analysis detailing your home's value as well as a comparison with similar homes in the area
Home Values in the Area
Average Home Value in this Area
Purchase History
| Date | Buyer | Sale Price | Title Company |
|---|---|---|---|
| Ibarra Hector M | $113,000 | Founders Title Co | |
| Myer Fred | -- | Western Title Company |
Source: Public Records
Mortgage History
| Date | Status | Borrower | Loan Amount |
|---|---|---|---|
| Open | Ibarra Hector M | $111,176 | |
| Previous Owner | Myer Fred | $52,419 |
Source: Public Records
Tax History
| Year | Tax Paid | Tax Assessment Tax Assessment Total Assessment is a certain percentage of the fair market value that is determined by local assessors to be the total taxable value of land and additions on the property. | Land | Improvement |
|---|---|---|---|---|
| 2026 | $504 | $52,058 | $35,280 | $16,778 |
| 2024 | $651 | $50,343 | $33,880 | $16,463 |
| 2023 | $651 | $46,551 | $31,325 | $15,226 |
| 2022 | $633 | $39,922 | $27,580 | $12,342 |
| 2021 | $625 | $29,947 | $17,885 | $12,062 |
| 2020 | $605 | $29,278 | $17,430 | $11,848 |
| 2019 | $588 | $27,072 | $15,855 | $11,217 |
| 2018 | $570 | $21,785 | $11,060 | $10,725 |
| 2017 | $559 | $19,875 | $9,345 | $10,530 |
| 2016 | $543 | $18,929 | $8,365 | $10,564 |
| 2015 | $542 | $18,340 | $7,945 | $10,395 |
| 2014 | $524 | $16,018 | $6,230 | $9,788 |
| 2013 | -- | $13,546 | $3,955 | $9,591 |
Source: Public Records
Map
Nearby Homes
- 1889 Merchant St
- 1885 Verano Dr
- 2127 Greyhaven Ln
- 2168 Cannonball Rd
- 1720 H St
- 1947 G St
- 2282 Cannonball Rd
- 848 Rock Blvd
- 1563 Steven Ct
- 2136 Roundhouse Rd
- 1780 Greenbrae Dr
- 1536 Irene Way
- 979 Damon Ln
- 2375 Roundhouse Rd
- 2371 Roundhouse Rd
- 2380 Roundhouse Rd
- 401 18th St
- 1830 C St
- 1836 C St
- 1655 Byrd Dr